|
MAIN PAGE
> Back to contents
Historical informatics
Reference:
Garskova I.M.
Dynamics of monetary part of wages and differentiation of workers' and employees' wages in the first half of the 1920s
// Historical informatics.
2023. № 4.
P. 68-95.
DOI: 10.7256/2585-7797.2023.4.69312 EDN: SUWSJF URL: https://en.nbpublish.com/library_read_article.php?id=69312
Dynamics of monetary part of wages and differentiation of workers' and employees' wages in the first half of the 1920s
Garskova Irina Markovna
Doctor of History
Associated professor, Lomonosov Moscow State University
119607, Russia, g. Moscow, ul. Ramenki st., 31-253, Ramenki st., 31-253, of. Ramenki st., 31-253

|
irina.garskova@gmail.com
|
|
 |
Other publications by this author
|
|
|
DOI: 10.7256/2585-7797.2023.4.69312
EDN: SUWSJF
Received:
07-12-2023
Published:
14-12-2023
Abstract:
One of the most important issues in the study of inequality in the twenties of the twentieth century of the Soviet government is the dynamics of differentiation of wages of workers and employees as one of the most important indicators. The subject of the study is the dynamics of the monetary and natural part of wages in the first half of the 1920s based on the materials of a set of statistical sources. The specificity of this period is that during the years of the civil war and war communism, monetary wages did not play a significant role. The problem of wage differentiation at the beginning of the recovery period practically does not relate to the monetary part of the salary, since the subsistence minimum was provided by in-kind payments, namely, rations, which played rather the role of a "social benefit", equalizing and independent of the quantity and quality of labor. The paper analyzes the differentiation of workers' salaries in the first half of the 1920s, and estimates its monetary part using a set of statistical methods. The dynamics of average salary values in general and for individual industries, the ratio of maximum to minimum wages for individual periods are analyzed, and more complex methods of measuring inequality are used. The main results are the characterization of the role of monetary wages in the process of transition from almost complete naturalization and the dominance of equalization to the restoration of the role of wages as a means of motivating work, increasing its productivity and, consequently, the standard of living of workers. A turbulent period of a fairly rapid and disordered transition process to a reduction and cancellation of in-kind payments and a return to normal principles of remuneration has been revealed. A comparison of the dynamics of natural and real wages in regional and sectoral aspects, for capitals and peripheries; for industrial workers and employees, as well as for co-workers; shows the possibilities of statistical processing and data analysis, including, in addition to descriptive statistics methods, approaches such as calculating decile coefficients and the Gini index.
Keywords:
labour, wages, industry, workers, employees, trade unions, differentiation, measurement, analysis, statistics
This article is automatically translated.
You can find original text of the article here.
The presented work was carried out within the framework of the project "The evolution of income and property inequality in Russia: from the Great Reforms to the "Great Turning Point" in the regional dimension (statistical and geoinformation analysis)", supported by the Russian National Fund (grant No. 21-18-00509). The study of income and property inequality is one of the most pressing issues of economic history related to the study of socio-economic processes in Russia in the second half of the 19th century and early Soviet society. One of the most important indicators of inequality is the differentiation of wages in various aspects: the amount of cash and in-kind payments, the cost of daily food rations and the cost of a budget set of goods, the influence of regional, sectoral and educational (skill level) factors on the amount of earnings. The specificity of this period is that during the Civil War and the early NEP, monetary wages did not play a significant role. The problem of wage differentiation during the civil war practically does not relate to the monetary part of wages, since the subsistence minimum was provided by in-kind payments, rations, which played rather the role of a "social benefit", equalizing and independent of the quantity and quality of labor [1, p.370]. The monetary part of the salary was about 14% of earnings at the beginning of 1921 [1, p.66]. Qualifications practically did not play a role: skilled workers at that time received only 2% more than unskilled [1, p.61]. S. G. Strumilin gives the dynamics of the ratio of earnings of a skilled worker of the highest category and earnings of a laborer from August 1917 to mid-1921.: Table 1. The ratio of the salary of a skilled worker to the salary of an unskilled one [2, p.35] | 1917 | August | 232% | | 1917 | November | 168% | | 1918 | september | 130% | | 1919 | september | 109% | | 1920 | | 104% |
| 1921 | 1 half | 102% | It was during the period of the revolution and the civil war that the conflict of differentiated and equalizing wage policies manifested itself in the most contrasting way. Even more clearly, the principle of equalization, which leveled the qualification factor, affected the remuneration of employees, engineers and technicians. This was due to the fact that in 1918-1920, class differentiation of the supply of food to the entire population was introduced. In St. Petersburg, the adult population of the city was divided into four categories: workers of heavy physical labor; workers of light physical labor and employees; persons of intelligent and liberal professions and persons not engaged in labor (industrialists, merchants, homeowners). Products were distributed to these categories in proportion 8 : 4 : 2 : 1 [3, p.83]. In Moscow, there was a similar system: workers working in particularly difficult physical conditions; workers engaged in simple hard physical labor; workers engaged in light labor, employees and people of liberal professions; and people living on unearned incomes. Products for these categories were given in a ratio of 4 : 3 : 2 : 1 (These data are based on the work of: Vishnevsky N. M. Principles and methods of organized distribution of food products and basic necessities. M., 1920). In the autumn of 1918, the People's Commissariat for Food approved a general ration system, which was introduced everywhere, mainly in provincial cities. It consisted of three categories (workers, employees, non-labor elements), with rations in the proportion of 4 : 2 : 1 [3, p.84]. According to S. G. Strumilin, in 1918-1920. "... in the monetary part, the engineer of the highest tariff category was provided with a fourfold rate compared to the watchman or cleaner of the lowest category. But the rations were distributed according to a special class principle, and the workers received a larger ration than the employees. And as a result, it came to such curiosities that the total legal earnings in rations and money of an engineer of the 35th category were lower than the earnings of the least qualified laborer or watchman of the 1st category" [4, p.388]. Equalization led to a decrease in labor productivity after the revolution, which, according to S. G. Strumilin, was influenced by such a psychological factor as "aversion to forced labor... When the workers finally felt themselves masters of the situation, they immediately wanted to realize their victory by easing the conditions of their hard labor. One of the first requirements was the requirement to reduce the speed of movement of some actuators by 10-20%. Further, the working day was reduced in approximately the same proportion, piece rates were eliminated, which increased the intensity of time-based work by two or so times. The authority ... of the administration has fallen to a minimum..." [4, p.46]. One of the most important directions of the state's economic policy during the NEP period was the return to the principles of differentiated wages. According to the data cited by S.G. Strumilin, already in the second half of 1921, differentiation began to grow: Table 1a. The ratio of the salary of a skilled worker to the salary of an unskilled one [2, p.35] | 1921 | 1 half | 102% | | 1921 | II half | 173% | | 1922 |
I half | 244% | | 1922 | II half | 262% | It follows from the above table that in the second half of 1921, the salary of a skilled worker relative to the salary of an unskilled one was 173%, and in 1922 – 244% in the first half of the year and 262% in the second. However, S. N. Prokopovich noted that S. G. Strumilin's data exaggerate the degree of inequality, since they are not based on statistical data, but were obtained by the author on the basis of studying tariff rates and data on natural forms of wages distributed among workers according to the principle of social security [3, p.89]. Nevertheless, the gradual stabilization of the financial system in 1923-1924 and the implementation of monetary reform began to contribute to the restoration of the role of wages as a factor in increasing labor productivity and motivation. This recovery in the first half of the 1920s was quite difficult: the pre-war level of differentiation in the payment of skilled and unskilled labor was not achieved even in 1924. However, in 1925 and 1926, the policy of the Central Committee of the People's Commissariat of Labor and branch trade unions, as well as the People's Commissariat of Labor, changed again in favor of "equalization" – the convergence of wage standards for skilled workers and unskilled workers. This process continued in the second half of the 1920s. Our study of the differentiation of salaries of industrial workers and employees for this period, conducted on data from different levels of aggregation, generally confirmed the existence of a policy of equalization (equalization) of salaries of industrial workers and its dependence on industry specifics [5]. At the same time, in certain industries at the level of various professions, it was revealed that the equalization process was primarily focused on increasing the wages of the lowest-paid groups of workers. At the same time, the salaries of skilled workers increased much more slowly, and sometimes even decreased, which obviously led to a decrease in differentiation. The period of the 1920s-1930s. In general, A. K. Sokolov characterized it as a struggle of an equalizing and differentiated policy in the field of remuneration for work [6, p.43]. A study of the dynamics of wage differentiation in the second half of the 1920s [5] revealed the existence of several trends: for example, for railway workers and printers, the gap between the salaries of high- and low-paid categories of workers not only did not decrease, but even increased slightly, for metalworkers and textile workers, this gap actually remained unchanged, and only in the dynamics of salaries of women textile workers, as well as workers in the construction industry, the gap was reduced, i.e. the equalization policy was implemented. * * * In this paper, we study the differentiation of wages for the first half of the 1920s, when the role of the monetary part of wages in wages was not significant. The earnings of workers in these years consisted, conditionally, of three parts: 1) the monetary part, 2) the natural part (food ration, apartment, clothing, etc.) and 3) the "illegal" part, i.e. theft of factory property, purchase of products using cards for non-existent persons, etc. [1, pp.28-30] The dynamics of the ratio of the monetary and natural part of the wages of factory workers in Russia in the period 1913-1921 is shown in Table 2, constructed by S. G. Strumilin on the basis of budget surveys and surveys Power supply: Table 2. The average monthly standard of living of industrial workers (in rubles 1913) [4, p.386] | Years | Legal earnings | Other income | All income | | |
With money | in kind | In rubles. | In % | | 1913 | 23,6 | 1 | | 24,6 | 100 | | 1914 | 23,3 | 1 | | 24,3 | 99 | | 1915 | 22,1 | 1 | |
23,1 | 94 | | 1916 | 21,3 | 1 | | 22,3 | 91 | | 1917 | 18,3 | 1,9 | | 20,2 | 82 | | 1918 | 4,73 | 4,26 | 1,5 | 10,5 | 43 |
| 1919 | 1,4 | 5,37 | 1,7 | 8,5 | 35 | | 1920 | 0,49 | 6,11 | 1,7 | 8,3 | 34 | | 1921 | 0,96 | 5,99 | 1,7 | 8,7 | 35 | | 1922 | 4,65 |
4,85 | 0,8 | 10,3 | 42 | According to this table, the minimum wage values are in 1920 – the salary level actually fell three times compared to the pre-war 1913. This was accompanied by an even sharper drop in the monetary part, which amounted to 0.49 rubles in 1920. or less than 6% of the total salary. The natural part of earnings amounted to almost 74%, and other components – even more than 20%. If we take into account the huge inflation, the existence of a state monopoly on the most important products, the prohibition of private trade and strict regulation of the distribution of goods, the monetary part of wages lost any importance compared to the natural part, i.e. food distributions. Huge inflation, the depreciation of the ruble, the lack of sufficient food on the market – all these factors reduced the role of cash payments as an incentive to work. The real incentive during this period was in-kind payments, primarily food rations. A monthly salary in 1920 could provide a very modest level of food for only two or three days. It is known that at the IV Congress of Trade Unions in May 1921, delegates spoke in favor of a complete replacement of cash wages in kind [7, pp.400-410]. Even in the early years of the NEP, in-kind payments were maintained, and workers and trade unions held fast to them. And although food supplies were the main factor in ensuring life, since the second half of 1921, in–kind monetary wages in hyperinflation conditions grew rapidly – in 1921, the average salary of industrial workers in Russia increased by about 180 times, and the salary of employees by 150 times. To take into account the impact of market conditions and the calculation of the minimum wage by trade unions, a "sliding scale" system was proposed: the average percentage of the salary calculation rate changed in accordance with the market value of the minimum set of products on the local market. However, the system of such regional minimums turned out to be ineffective, there were not enough funds to pay the calculated rates. As A. A. Ilyukhov notes, "the increase in high prices in the winter of 1921/22 due to crop failure and famine did not allow ... to keep the achieved by November 1921. the salary level is 10-13 rubles in Moscow and 6-7 rubles in the provinces" [1, p.91]. In addition, food supply plans were not implemented everywhere, food rations were not fully issued and with delays. The regional minimum wage system had to be abandoned. Since February 1922, by the resolution of the Council of People's Commissars, all issues related to the formation of wage funds were transferred to the Central Fund Commission on Wages (Cefond) [8, p.32]. As a result, salary rates for individual industries and districts were set based on "economic and political expediency." But this system also had to be abandoned. A. A. Ilyukhov provides data on the comparative dynamics of prices and in–kind salaries in late 1921 - early 1922. (from November 1921 to May 1922). During this period, prices increased 5,000 times, while salary rates increased only 1,500 times. As a result, in the first three months of 1922, the real wages of workers fell to 57%, 46% and 30% of the October 1921 level [1, pp.91-92]. Despite the fact that the monetary part of the salary was very insignificant until the middle of 1921, quite definite trends are found in its dynamics. As part of the total earnings, wages accumulate the influence of all factors that determine the amount of this earnings – these are price increases, the economic conditions of individual districts and industries, and the tariff policy of trade unions. Obviously, despite the weak share, the monetary part reflects the main factor determining the total amount of earnings at this time – the cost of living. The cost of living can be estimated through such an indicator as the cost of a daily food ration. Its creation began with an attempt in June 1918 to establish current price accounting and build an index for Petrograd based on a food ration of seven products. Since January 1919, in Petrograd and a number of other markets in the Northern region, an index of prices of 18 food products began to be calculated based on the pre-war norm of 3,600 calories, but it was not possible to maintain the pre-war norm, so the all-Union index was approved based on rations for 16 goods at a rate of 2,700 calories. This index (see Table 3) was in effect until the end of 1921 [4, p. 403] Table 3. Composition of the daily food ration of 2,700 calories in 1920-1921 [9, p.250] | |
The name of the products | In what units | The cost of living | There are no calories in it | | 1. | Black bread | lb. | 0,6 | 420 | | 2. | Rye flour | – ” – | 0,8 | 960 | | 3. | Cereal | – ” – | 0,08 |
104 | | 4. | Potato | – ” – | 3,2 | 832 | | 5. | Cabbage | – ” – | 0,3 | 15 | | 6. | Beets, carrots, etc. | – ” – | 0,1 | 10 | | 7. | Sugar and sweets |
– ” – | 0,03 | 48 | | 8. | Vegetable fats | – ” – | 0,03 | 108 | | 9. | Animal fats | – ” – | 0,01 | 29 | | 10. | Meat | – ” – | 0,2 | 80 | |
11. | Herring | pc. | 0,1 | 30 | | 12. | Fish | – ” – | 0,05 | 20 | | 13. | Milk | Booth. | 0,1 | 40 | | 14. | Eggs | pc. |
0,05 | 4 | | 15. | Salt | – ” – | 0,07 | 0 | | 16. | Tea | – ” – | 0,01 | 0 | | | Total | | | 2700 | The cost of rations at market prices in the face of inflation was growing rapidly, and at an accelerating pace. Figure 1 shows a graph based on the average monthly data on its value from Table VI of the Statistical Yearbook of the Central Executive Committee for 1921 for the provinces of the European part of the RSFSR [9, p.237]. In three years, the cost of a budget set in rubles has increased almost a thousand times or by 3 orders of magnitude (this dynamics is shown in the graph on a logarithmic scale). 
Fig. 1. Dynamics of the cost of daily food rations in the period 1919-1921. For 1921, the source provides information on the cost of rations for 29 provinces, including provincial and county towns. Since the differentiation in the regional aspect during this period was determined precisely by the cost of the budget set, we calculated the value of the Gini index for 29 provinces for 1921; this value (0.135) is relatively small. The coefficient of variation (27%) of the cost of the budget set for the provinces also indicates sufficient uniformity of this population, i.e. we see a general low standard of living in the country. Since 1922, the budget set (an analogue of the consumer basket) included 15 types of food and 9 basic necessities. The cost of a budget set served as a monetary unit: the entire set cost 10 budget rubles, and one tenth of the cost of such a set was called a "conditional budget ruble". In the early 1920s. for the average salary of a family of two people with one employee, it was possible to buy from 1.18 to 2.04 such sets monthly (in 1913, for the average salary of a worker in large industry, per family of two people, 2.49 such budget sets could be bought monthly). Since 1922, in addition to food products, several goods from clothing and shoes and other basic necessities have been introduced into the index (a total of 24 goods), since 1924, the weights of goods have been revised in this set. From December 1926, the set was again increased to 40 items, including the cost of rent and some utilities [4, p.403]. It is possible to visually express the relationship between the amount of wages and the cost of living if you compare the wage figures directly with the data on the cost of living, i.e. with the cost of a daily food ration. In the essay "The movement of monetary wages", included in the handbook "Labor statistics in industrial institutions; turnouts, absenteeism and wages of workers in 1920", the head of the Department. The Department of Labor Statistics, G. S. Pollak, provides a table in which the provinces are divided into 4 groups according to the value of the daily food ration of 2,700 calories, and average earnings figures are given for each group. Information on the cost of rations is given in the source for 29 provinces, and information on wages for 19 provinces. Thus, G. S. Pollak's essay uses data on 16 provinces and cities of the RSFSR, for which information is available on both indicators for the whole of 1920 (data for three provinces are incomplete). Table 4. Grouping of provinces by the value of the daily food ration [10, p.19] | Group | The cost of a daily food ration (rubles) | Average monthly earnings (rubles) | Fluctuations (rubles) | | I | over 3,000 | 8466 | 4624-9928 | | II | 2400-3000 | 5609 |
3026-7394 | | III | 1800-2400 | 3840 | 2794-4985 | | IV | less than 1800 | 2785 | 1974-3272 | The first group, according to G. S. Pollak's classification, includes Moscow, Petrograd and Tula Gubernias; the second – Nizhny Novgorod, Vladimir, Arkhangelsk and Tver gubernias; the third – Cherepovets, Novgorod, Vologda, Ivanovo-Voznesenskaya, Yaroslavl and Kostroma Gubernias; the fourth – Vyatka, Perm and North-Dvina province. The table shows that in areas with high food prices, salaries are higher, which is not surprising. Compared to the cost of living, the influence of other factors, in particular, qualifications, recedes into the background. The average amount of earnings does not show a connection with the average tariff level characterizing the qualifications of workers. The relationship between the cost of living and monetary earnings affects here quite definitely. As the transition from areas with high prices for vital products to areas of cheaper prices, there is a pronounced decrease in wages (from 8,466 rubles in the first group to 2,785 rubles in the fourth group). Thus, changes in the amount of earnings in the provinces are consistent with the real cost of living. The correlation coefficient calculated by us between the monetary part of the salary and the cost of daily rations in 1920 takes values in the range from 0.86 to 0.70, decreasing by the end of the year. To assess the degree of heterogeneity of the aggregate of provinces in 1920, coefficients of variation were also calculated, which demonstrate that the heterogeneity in the distribution of salaries across provinces is noticeably lower, at about 33%, than the heterogeneity by industry (trade unions), which reaches 44%. At the same time, in provinces with low salary levels, the variation by industry is the lowest (for example, in the Vyatka province it is 15%), and in provinces with higher salaries, the variation is the highest (for example, in the Moscow province, which is leading in terms of salaries, the variation by industry reaches 65%). The smallest differences between provinces (no more than 30%) are in the salaries of food producers, tobacco workers and printing workers; the sharpest regional differences are recorded in the salaries of builders (above 100%). The calculation of the Gini index for the distribution of salaries between provinces gives a value of 0.23, i.e. It does not reveal significant regional differences, as well as the coefficient of variation. If we compare the degree of inequality not in the distribution of salaries, but in the distribution of the cost of daily food rations, representing the real earnings of workers during this period, then at the beginning of the year a higher degree of differentiation is revealed (see Table. 5), which then reveals a steady downward trend. Table 5. Dynamics of indicators of differentiation of provinces in 1920 by the cost of daily rations | Period | Coefficient of variation (%) | The Gini coefficient |
| January | 67,4 | 0,35 | | april | 59,6 | 0,32 | | July | 51,5 | 0,27 | | october | 32,8 | 0,18 | | January 1921 | 33,2 | 0,18 | The year 1921, which determined the beginning of the NEP and the change in the general direction of economic policy, was a turning point in terms of wages, which, in terms of its size and structure, also underwent significant changes. Of course, as in the previous period, monetary wages, especially in the first half of 1921, accounted for a much smaller part (about 10%) of the total salary, but the dynamics of 1921 shows that its nominal value increased many times by the end of the year. A comparison of nominal earnings at the beginning and end of the year shows rapid growth – earnings in December exceed January by 139 times. However, this increase was very uneven – for the entire first half of the year, nominal earnings increased only 1.5 times, and this despite the fact that the cost of a daily ration of 2,700 calories increased 3 times. Accordingly, in January, cash earnings corresponded to the cost of two daily rations, and in May–June – only one ration. The picture is different in the second half of the year. Already in July, nominal earnings increase to almost four in January, by August – almost twice more, and then every month (except December) it increases even more than twice.
The real salary (calculated in rations) shows only a slight increase until July. Further, due to lower market prices, wages begin to grow rapidly, and even with a seasonal increase in market prices in October, real earnings continue to increase (with the exception of December). Calculating the ratio of December earnings in 1921 to January earnings according to Table V.1 of the Statistical Yearbook for 1921 gives an 18-fold increase in real wages (in daily rations, this is an increase from 2.3 to 42 rations. At the same time, we emphasize that in 1921 real earnings grew almost 10 times slower than nominal earnings [11, pp.27-28]. The real change in the amount of monetary wages begins in the second half of 1921, which can be explained by the influence of two factors: the introduction of the so-called collective supply system and the initiatives of local tariff authorities. G. S. Pollak believes that these initiatives were decisive until December, and as arguments cites the dynamics of wages for trade unions, which, with a general increase in wages, differs significantly: the wages of metalworkers increased significantly below the average growth rate in the second half of the year; for chemists, textile workers and printers, the wage growth rate was close to the average (a collective supply system was introduced at such enterprises); on the contrary, for food processors, garment workers, tobacco workers and tanners, wages grew much faster than the average (for food processors – even three times) [11, p.29]. Analyzing the monthly dynamics of wages for various unions as a whole and separately for enterprises transferred to collective supply, G. S. Pollak concludes that the rapid growth was primarily due to the activities of local tariff authorities, which for a short time gained independence in this matter – from the IV Congress of Trade Unions (May 18-25, 1921) to the Order The WTSPS (December 1, 1921), which limited the local initiative. Indeed, the dynamics of wages by trade unions varies significantly: by the end of the year in those industries where the collective supply system was introduced, the rate of wage growth was slow, and the most intensive wage growth was observed in those industries that produced products intended for general consumption and had the opportunity to quickly sell their products on the free market. This provided the material basis for raising salaries by local tariff authorities [11, pp.29-30]. G. S. Pollak writes about "the diversity that defies any logical definition, which is found in individual provinces and chaotic disorder" [11, p.31] in salary data in 1921. "The shooters in this regard are two provinces of the western district: Minsk and Vitebsk, in which, already in January 1921, the nominal salary is more than 25 thousand rubles. in the first and almost 12 thousand rubles. in the second; in the rest of the provinces, at this time it ranges from 1,101 to 7,302 rubles. and only in Moscow and Petrograd it rises to 8,477 and 9723 rubles. The same two provinces retain the highest average wages up to the month of April; in May, Stavropol province with an average salary of 36610 rubles (with a total average of 8512) is promoted to the first place; in July, Omsk, which immediately raises wages from 9246 rubles in June to 233038 rubles in July, etc... The ratio between the maximum and minimum reaches unprecedented proportions." These calculations are based on data from Table V.1. "The movement of monetary earnings of industrial workers in 1921" [9, pp.226-227]. In 1921, the ratio of the highest monthly wages of industrial workers to the lowest experienced significant fluctuations: an increase from 13.8 in February to 207.3 in August, with a sharp drop to 26.4 in October and a slight increase to 34.6 by the end of the year. However, the coefficient of variation, which rises to 184% in the first half of the year, falls to a minimum value of 45% at the end of the year due to the fact that the distribution of salaries across the provinces and regions of Russia becomes more homogeneous. Perhaps these fluctuations were also reflected by the fact that in the last months of 1921 the cost of in-kind payments, partially at a reduced price, was deducted from the accrued cash salary (the effect of salary naturalization). Due to the sharp increase in nominal wages, starting in June 1921, under the influence of non-economic factors, the monthly dynamics of such differentiation indicators as the ratio of maximum to minimum wages and the coefficient of variation becomes uninformative. More reliable in this situation are the annual averages, which hide the sharp differences in monthly dynamics. We have calculated the average annual ratio of maximum and minimum wages in the provinces of Russia, equal to 22, the coefficient of variation is 73% and the Gini coefficient is 0.36. The results obtained confirm G. S. Pollak's opinion about the "chaotic and variegated" data characteristic of salaries in the transitional year, 1921. It should be noted that the differentiation of the distribution of the cost of daily food rations in 1921 generally gives a more homogeneous picture: the ratio of the maximum average annual cost to the minimum is about the same as for nominal salaries (24.1), but the coefficient of variation and the Gini index are less: 26% and 0.13, respectively. This result shows that market prices were less influenced by subjective factors regulating wage growth. According to trade unions, differentiation in 1921 was noticeably lower than differentiation by region: the ratio of the highest annual salary to the lowest is 4.4, the coefficient of variation is 39%, the Gini index is 0.22. Apparently, this was due to the general policy of industry trade unions seeking to compensate for price increases with the maximum possible increase in salaries S. G. Strumilin draws attention to the fact that the rapid growth of the monetary part of wages was facilitated by an increase in the share of piecework forms of remuneration: "the issue of piecework, despite the fundamentally negative attitude of workers' organizations to it, has been raised again and resolved in a positive sense," explaining this by the fact that "with the existing nutrition, extremely insufficient in order to meet the normal needs of a working organism, ... piece-work, giving additional earnings that increase faster than energy consumption for labor intensification, even somewhat facilitates the position of the worker in this regard… This circumstance, apparently, explains the seemingly unexpected fact that workers, who have always fought against piecework, are currently seeking a transition to piecework payment" [4, p.362]. This trend is most clearly seen in the data in Table V.3 "Monetary earnings of workers by production unions and forms of remuneration (consolidated according to the RSFSR)" [9, pp.229-232] by trade unions of builders, tanners, garment workers (see Fig. 2-4).
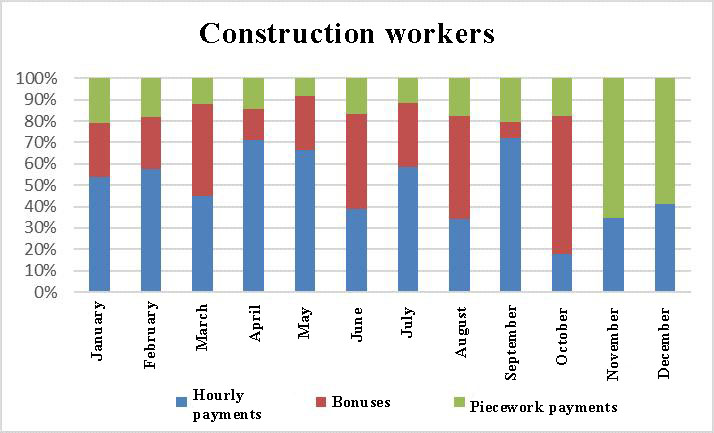
Fig. 2. Increase in the share of piecework form of remuneration in 1921. the builders' union 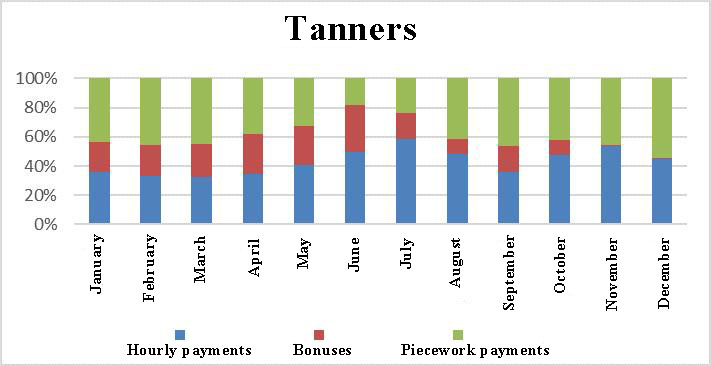
Fig. 2. Increase in the share of the piece-rate form of remuneration in 1921. the trade union of tanners 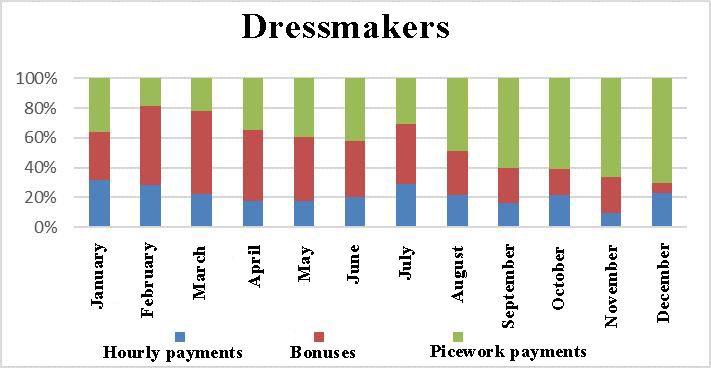
Fig. 2. Increase in the share of the piece-rate form of remuneration in 1921. the trade union of garment workers An analysis of employee salaries shows that their salaries grew faster in 1921 than workers' salaries (see Fig. 5), the ratio of employee salaries to workers' salaries was quite stable – at the level of 1.4 to 1.8, and, moreover, there is a noticeable trend of a slight decrease in this value. As for workers' salaries, employees have sharp fluctuations in the ratio of maximum to minimum wages in the provinces. The same effect can be seen on the dynamics of the coefficient of variation and on the dynamics of the Gini index (according to Table V.2. "The movement of monetary earnings of industrial employees in 1921" [9, p.228]), therefore, for employees, as well as for workers, we assess differentiation by average annual indicators. 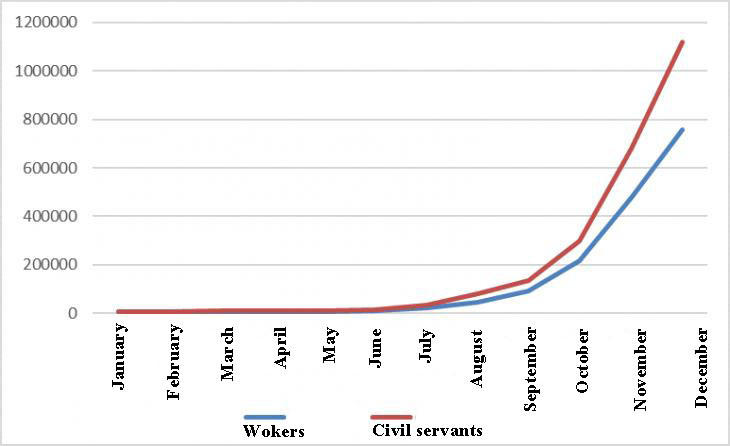
Fig. 5. Dynamics of nominal salaries of workers and employees in 1921 On average, in 1921, the coefficient of variation in the level of salaries by region (54 provinces) for both workers and industrial employees, it is 72-73%, and for trade unions (16 unions) it is reduced to 39% for workers and 37% for employees. A similar effect is demonstrated by the Gini index, which is equal to 0.35–0.37 for regional wage differentiation and 0.19–0.21 for industry. The differentiation in the cost of daily food rations is significantly lower – the coefficient of variation is 24%, the Gini index is 0.12. * * * Turning to the data on the salaries of workers and employees in 1922-1924, we note that in the sections Labor (Labor and trade unions) The statistical yearbooks of the CSB for 1922-1923 and 1924 [12] [13] contain information on the real wages of workers and employees and its monetary part (as well as on the cost of living – these are the values of the cost of a budget set of goods and a budget index). Using these data, the trend that began in 1921 becomes more noticeable in the following years The most important characteristic of 1922 is a decisive change in the ratio of the components of wages: cash payments and the natural part of earnings provided by food and basic necessities. In 1922, the natural part of earnings consisted mainly of products of their own production. Although the process of increasing the monetary share of earnings began in the second half of 1921, in the first third of 1922 this process slowed down due to the rise in prices, and the natural part of earnings still continued to prevail, especially in the provinces. But starting in May, under the influence of a decreased rate of price growth, increased trade turnover, as well as increased trends towards a monetary wage system, a decisive drop in the share of in-kind payments was already marked by the end of the year. In the table. 6 it is possible to trace this sharp fracture. Table 6. The monetary part of wages as a% of the total earnings of workers in large-scale industry in 1922 [14, p.202] | | Moscow | Leningrad region. | Provincial lips. | The average for the USSR | | | Including |
| For all of you | metal. prom. | text. prom. | chemical industry | | January | 37,8 | 42,9 | 16,4 | 22,5 | 15,5 | 19,4 | 29,6 | | february | 49,9 | 47,4 | 22,4 | 29,3 |
16,6 | 33,3 | 36,4 | | March | 61,9 | 54,1 | 19,2 | 29,2 | 22,7 | 31 | 47,2 | | april | 48,4 | 51,4 | 26,1 | 26,1 | 21 |
20,4 | 43,7 | | May | 69,1 | 63,6 | 27,9 | 38,4 | 34 | 29,8 | 55,2 | | June | 75,5 | 73,6 | 36,2 | 45,6 | 37,1 | 45,4 |
63,8 | | July | 77,6 | 76,1 | 42 | 51,3 | 34,3 | 47,1 | 82 | | august | 79,7 | 79,9 | 60,4 | 65,9 | 60 | 61,2 | 80 |
| september | 85 | 82,1 | 59,1 | 66,7 | 64,5 | 61,3 | 80 | | october | 93,4 | 77,6 | 60,6 | 68,1 | 74,1 | 68,6 | 78,3 | | November |
94,8 | 90,4 | 66,3 | 75 | 80,8 | 57,2 | 84,1 | | december | 94,5 | 88 | 72,1 | 78,4 | 81,1 | 63,2 | 87,5 | | in MS. per year | 77,1 |
74 | 45,1 | 53,1 | 50,9 | 45,7 | 67,2 | According to individual unions, the monetary part of the salary of metalworkers grew at the fastest pace in 1922 - from 15 to 80% (more than five times), for textile workers it increased from 19 to 63% (more than three times), for chemists – from 30 to 87% (almost three times). In general, the variation in the share of the monetary part of wages (for large enterprises) during 1922 is decreasing. A detailed analysis of the monthly dynamics of both the monetary and in-kind part of the salaries of workers and employees was carried out by A.G. Rashin in the article "Wage movement in 1922". Since the calculation of wages in Soviet rubles with rapid and uneven price growth does not give a real idea of the dynamics of the process, the author expresses the salary in the cost of a budget set of food and basic necessities (this set was estimated in 1913 in Moscow and Petrograd at 10 rubles, and on average in Russia at 7 p. 36 K.) The assessment of the monetary part of the salary was carried out by A. G. Rashin according to the index on the 1st day of the next month, since wages were repeatedly paid late (see Table 7). Table 7. Average monthly earnings of industrial workers in 1922 [14, p.194] | | In relation to the cost of a budget set of products | | Throughout the industry | Including | | On metal processing | According to the textile industry | According to the chemical industry |
Moscow | Petrograd province. | | January | 75,2 | 82,6 | 65,9 | 69,8 | 87,7 | 85,6 | | february | 80,2 | 88,7 | 61,5 | 70,5 | 98,3 | 80,2 | | March |
81,5 | 91,7 | 69,5 | 94,8 | 85,8 | 99,7 | | april | 77,4 | 91,4 | 61,0 | 91,0 | 77,1 | 89,5 | | May | 89,6 | 97,7 | 71,4 |
115,3 | 121,6 | 99,2 | | June | 99,0 | 105,8 | 79,8 | 118,4 | 128,7 | 99,5 | | July | 107,4 | 106,2 | 84,0 | 128,7 | 127,3 | 119,7 | |
august | 113,0 | 121,0 | 93,0 | 154,1 | 143,6 | 143,6 | | september | 118,3 | 138,5 | 92,1 | 154,6 | 153,1 | 153,3 | | october | 110,6 | 121,4 | 84,5 |
124,2 | 143,5 | 136,2 | | November | 125,4 | 154,4 | 86,3 | 168,4 | 173,9 | 195,0 | | december | 142,0 | 156,2 | 115,0 | 162,7 | 192,2 | 189,1 |
| in MS. per year | 101,6 | 113,0 | 80,4 | 120,5 | 127,7 | 124,2 | It can be seen that in the first third of the year, under the influence of the rapid fall in the ruble exchange rate, when prices doubled almost monthly (in January – by 89%, in February – by 111%, in March – by 119%, in April – by 65% [14]), real wage growth stopped, which began in in the last quarter of 1921, and in some industries, for example, textiles, real wages even fell. But in the industry as a whole, in the first third of the year, real earnings remained at a fairly stable level: the real wages of workers for January–April averaged about 80% of the cost of a budget set of products throughout the industry, since the basis of tariff policy was the principle that earnings should increase as prices rise. In addition, in the total amount of wages, the cost of in-kind payments in the first third of 1922 still amounted to more than 70% of total wages. From May to September, the real wage level continuously increased due to a decrease in the rate of price growth due to favorable harvest conditions (in May, prices increased by 22%, in June – by 14%, in July they fell by 3.5%, in August they increased by 7%, in September – by 23% [14, p.195]). On average, across the industry, September earnings exceeded January earnings by 57%. The average salary of industrial workers since July has already exceeded the cost of a budget set. According to A.A. Ilyukhov, "since June 1922, wages 1, wages began to feed" [1, p.88]. During this period, taking into account the changed economic conditions and the improvement of the situation of industry, wage regulation begins through the application of collective agreements, and by September a significant part of industrial workers already receive it in this way. However, the growth rate of real wages in the first 9 months of 1922 varied greatly by industry: metalworkers' earnings increased by 67.6%, textile workers by only 39.7%, and chemists by 121.5%. In October, a seasonal price spike caused a drop in real wages on average across the industry, but at the end of the year, earnings increased significantly not only under the influence of a slower price increase compared to October, but also due to a change in the tariff schedule and the ongoing process of rising prices of industrial products compared to agricultural products. Thus, by December, the wages of industrial workers exceeded the September level by 20%. As a result, wages for the entire industry increased by 88.8% in 1922, but differentiation by industry remained: in the metalworking industry, growth (89.1%) corresponded to the average level, in the textile industry it was below average (74.5%), in the chemical industry it was noticeably higher (138.1%). It should be noted that the growth of earnings in monetary form was accompanied by a decrease in the free provision of a number of natural goods to workers (utilities, etc.), the restoration of the payment of a number of services and a decrease in the role of illegal earnings, common during a period of low wages, so we must agree with A. G. Rashin that the estimate of an 88 percent increase in earnings in 1922 the year seems to be overestimated [14, p.195]. As in previous years, earnings in the capitals noticeably exceeded the average level for the entire industry: in Moscow and Petrograd, earnings increased almost equally over the year – by 120%.
In his research on the budgets of workers and employees in the period 1922-1926. [15] [16] G. S. Pollak concludes that since 1923, wages have begun to occupy a predominant place in the family budget. Thus, since the end of 1922, the salary in the income budget of family workers has been more than 80% [15, p.171]. Along with the growth of the budget, its structure is also noticeably changing, for example, the variety and quality of food is improving. One of the most characteristic moments of the evolution of the working budget in the period under review was the shift of the "center of gravity" of nutrition from bulky and cheap plant products to more physiologically valuable and more expensive products of animal origin [15, p.177]. Table 8 shows the dynamics of salaries of employees in industrial enterprises (the average salary and the ratio of wages of employees in industry to wages of industrial workers in the last months of the quarters of the year for the entire industry and its main branches are indicated). Table 8. Average monthly earnings of industrial employees in 1922 (data were used to construct the table: [14, p.207]) | | As a percentage of the cost of a budget set of products | | Throughout the industry | Including | | On metal processing | For the textile industry | According to the chemical industry | As a percentage of the prom's earnings. workers | | March | 119,9 | 115,1 | 122,6 | 113,2 |
147,1 | | June | 157,7 | 155,8 | 148,1 | 180,9 | 159,3 | | september | 196,8 | 202,1 | 176,0 | 225,4 | 166,4 | | december | 248,6 | 234,3 | 230,6 |
222,6 | 175,1 | It can be seen that the earnings of employees across the industry and its individual sectors differed slightly, however, compared with the earnings of workers, the growth rate of employees' salaries is higher (by 50% in the first quarter to 75% by the end of the year). As for the ratio of the monetary and natural part of the salaries of employees, a similar process is taking place here, but it proceeds more quickly than that of workers. Table 9 provides information on the monetary part of the salaries of industrial employees in 1922. Table 9. The monetary part of the monthly earnings of industrial employees in 1922 (data were used to construct the table: [14, p.207]) | Months | For 34 provinces | Including | Including | | | Moscow | Petrograd | Province | On metal processing | For the textile industry | According to the chemical industry | | March | 33,7 |
61,4 | 52,0 | 25,9 | 24,0 | 44,0 | 39,7 | | June | 53,8 | 83,0 | 78,5 | 42,3 | 44,4 | 60,3 | 74,8 | | september | 75,1 | 91,2 |
84,2 | 69,4 | 75,0 | 70,1 | 86,4 | | december | 82,3 | 97,2 | 99,9 | 74,9 | 88,3 | 76,1 | 92,9 | The table clearly shows that during 1922, the in-kind wages of industrial employees were replaced by money, and in the capitals by December, the role of in-kind payments was already completely negligible. Metalworkers and chemists have already paid up to 90% of their salaries in money. Up to 25% accounted for in-kind payments in the provinces and among textile workers, where payment by manufacture was widely used. Table 10. The average monthly earnings of Soviet employees in April–December 1922 [14, p.210] | Months | As a % of the cost of a budget set of products | In % by April |
| April | 79,1 | 100,0 | | May | 106,6 | 134,8 | | June | 126,1 | 159,4 | | July | 137,1 | 173,3 | | August | 159,9 | 202,1 | | September | 151,7 | 194,8 | | October |
140,5 | 177,6 | | November | 178,5 | 226,9 | | December | 181,5 | 229,4 | A. G. Rashin provides data from questionnaire surveys of the Central Committee of the Union of Soviet Workers, characterizing the wages of Soviet employees in 1922. Table 10 shows the movement of actual wages in 25 provincial cities in 7 "through" institutions for the period from April to December 1922. Although the above table does not include metropolitan institutions where wages were higher, it also does not include county institutions with lower earnings, and therefore it can be assumed that the data provided are representative enough to characterize the dynamics of salaries of state employees. It can be seen that in 1922 there was a significant increase in the wages of state employees, and the growth rate of their wages was even higher than the growth rate of earnings of industrial workers. A slight drop in wages in September–October was caused, on the one hand, by a seasonal rise in prices, and on the other hand, by the partial withdrawal of Soviet employees from state supply in September and the final one in October. As A. G. Rashin notes, there are noticeable fluctuations in the amount of real wages for certain groups of institutions. In the sources used, it was recorded that the salary for the period October–December 1922 for a group of economic institutions (such as Gubprodkom, Gubfinotdel, Gubsovnarchoz, etc.) exceeded the average for all surveyed institutions by 16%, and the salary for a group of administrative institutions (such as Gubstatburo, Sovnarsud, etc.) was lower the average is 34%. In-kind payments, the role of which in the total wages of Soviet employees in April was less than that of workers (about 30% of total earnings), by the end of the year amount to an insignificant amount. In general, Soviet workers, despite the doubling of wages in 1922, had lower earnings by the end of the year than industrial workers compared to the pre-war period. Once again, it should be noted that the salaries of employees in the capitals exceed the salaries of employees in the provinces, where there is a high regional heterogeneity. Thus, in 1922 there was a significant change in the structure of salaries – an increase in their monetary component: for example, the real salary of workers in large industry (enterprises with more than 250 workers) in 1922 increased by about half, and its monetary component increased from 23 to 78%, the real salary of employees increased by 2.2 times, and its monetary part increased from 56 to 91% of earnings (calculated on the basis of Table VIII "Real earnings of workers of large industry in 1922" [12, pp.224-225]. This figure is highest in Moscow (almost 95%) and Leningrad (almost 90%), in the provinces – a little more than 70%. The structure of the CSO statistical yearbook for 1923-24 is quite different from the structure for previous years, for example, the list of provinces has been significantly expanded (now it is the entire territory of the USSR), Gubernian data on salaries of workers and employees are not published, and there is less information by industry: data on metalworking, textile and chemical industries are mainly provided (for capitals – also in the printing and food industry). The available information, however, allows us to conclude that there was a noticeable differentiation in the level of real salaries of workers by industry (with a coefficient of variation at 13-17%), industrial employees by industry and civil servants by groups of institutions (with higher coefficients of variation), and variations in the monetary part of wages are more than twice as high as variations the total salary. Figures 6 and 7 show a rather slow growth in real wages and an extremely rapid decrease in in-kind payments. 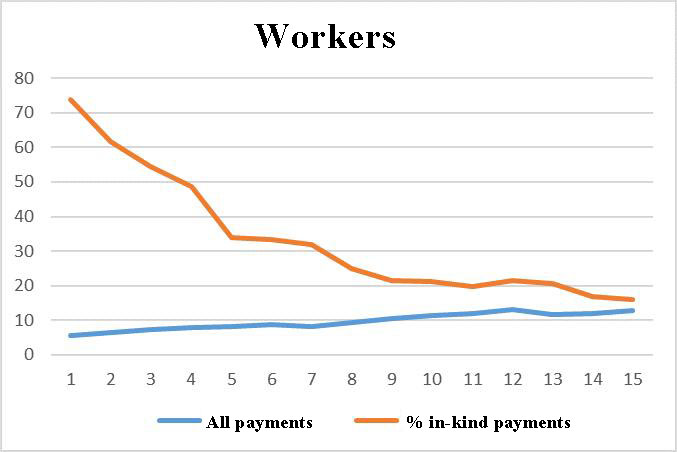
Fig. 6. Dynamics of real wages of workers in 1922 and decrease in in-kind payments
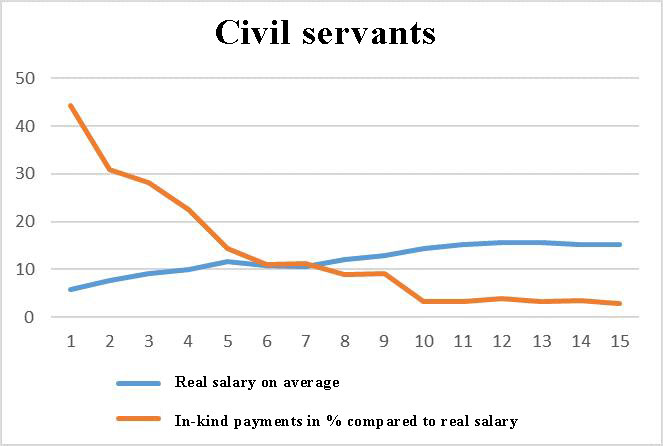
Fig. 7. Dynamics of real salaries of employees in 1922 and decrease in in-kind payments According to nominal earnings in red rubles, wage differentiation is more noticeable than in real earnings. This is due to the fact that highly paid industries are concentrated mainly in capitals and large centers, where the cost of budget recruitment significantly exceeded the average value in the USSR [17, p.635]. The variation in the cost of a budget set by province is characterized by a high value of the Gini index, at the level of 0.62. Perhaps this is due to the high differentiation of in-kind salaries in 1922. * * * In 1923/24, the trends laid down in the previous year developed, taking into account the fact that the share of cash payments was already dominant in both sectoral and regional aspects, therefore, the compilers of yearbooks from that time no longer pay special attention to the monetary part of salaries. During this period, wage differentiation is almost entirely determined by monetary earnings. Data from reference books for 1923-1924. They contain information that provides more detailed, interval distributions of workers and employees by salary, which allows us to study the differentiation in wages by individual industries and groups of industries using both the Gini index and decile coefficients. Analyzing the dynamics of salaries in 1923/24, we present the following table: Table 11. The average monthly earnings of workers in large industry for 1923/24 (the calculation included enterprises with more than 250 workers; on average, 1100 thousand workers were covered by this development of the CBST) (data are used in the table [17, p.635]) | Production facilities. groups | In conditional Moscow rubles | In % of the previous ones. the block | 1923-24 as a percentage of 1922-23 | | 1923-1924 | In MS. for the household year | 1923-1924 | | I quarter | II quarter | The third quarter | IV quarter |
1922-23 | 1923-24 | I quarter | II quarter | The third quarter | IV quarter | | All over the industry | 19,33 | 20,39 | 20,42 | 22,87 | 15,88 | 20,75 | 114,0 | 105,5 | 100,1 | 112,0 | 130,7 | |
Including | | | | | | | | | | | | | by metal. | 20,68 | 21,87 | 22,53 | 25,38 | 17,57 | 22,62 | 103,7 |
105,7 | 105,7 | 112,7 | 128,7 | | according to the textile. | 17,65 | 18,20 | 17,18 | 19,31 | 12,30 | 18,09 | 133,0 | 103,1 | 103, | 112,4 | 147,1 | | by chemistry. | 18,93 | 19,69 | 19,51 |
23,13 | 16,67 | 20,32 | 107,6 | 104,1 | 99,1 | 118,6 | 121,9 | | Including | | | | | | | | | | |
| | Moscow | 25,03 | 26,57 | 26,57 | 29,85 | 19,82 | 27,01 | 116,9 | 106,2 | 100,0 | 112,8 | 136,3 | | Leningrad province. | 25,81 | 24,48 | 25,24 | 28,92 | 20,28 | 26,11 |
117,3 | 94,8 | 103,1 | 114,6 | 128,7 | As can be seen from the table, in the 1923/24 economic year wages continue to rise, although not uniformly, taking into account the role of individual factors that directly influenced this process. Thus, in the first quarter of 1923/24, due to a slight increase in tariff rates, and mainly due to the approach of the timing of wage calculation to the timing of its payment, the monthly earnings of workers on average throughout industry increased by 14% compared with the last quarter of 1922/23. In the second quarter, there is an increase of another 5.5%, mainly in January. Among the most significant factors that influenced wage growth in January, one can point to the increase in tariff rates for some unions, the expansion of the tariff grid for metalworkers and partly for chemists, and the continued convergence of payment deadlines with the deadlines for calculating wages. In the third quarter, the real wages of workers on average across the industry remained at the level of the second quarter. In the fourth quarter, mainly due to the decrease in retail prices in August–September and a slight increase in piecework earnings, wages increased by 12.0%. For the entire economic year 1923/24, real wages increased by 30.7% on average across the entire industry. In individual industries, it should be noted that in metalworking, during the first three quarters of 1923/24, there was a continuous but relatively insignificant increase in wages; in the fourth quarter, wages increased immediately by 12.7%. With an average annual wage increase of 30.7% across the industry, the wages of metalworkers increased by 28.7%. Textile workers had a sharp increase in wages, mainly in the first quarter – by 33.0% and in the fourth – by 12.4%, in the third quarter earnings decreased slightly, as a result, over the entire economic year, the wages of textile workers increased by 47.1%. In the chemical industry, wage growth was below the overall average growth. In Moscow, workers' wages increased by 36.3% in 1923/24, and by 28.7% in the Leningrad province. Table 12. The average monthly earnings of workers in large-scale industry in the capitals and in the provinces for 1923/24 (the table is compiled according to [17, p.635]) | Neighborhoods | In the USSR | Including | The earnings of metropolitan workers as a% of the earnings of workers in the province | | By capitals | By province |
| | In the conditional. Moscow. in rubles | | 1 | 19,33 | 25,44 | 18,26 | 139,3 | | 2 | 20,39 | 25,51 | 19,52 | 130,7 | | 3 | 20,42 | 25,74 | 19,51 | 131,9 | | 4 | 22,87 |
29,38 | 21,75 | 135,1 | | The average for 1923/24 | 20,75 | 26,52 | 19,76 | 134,2 | On average, for the entire economic year 1923/24, the real wages of metropolitan workers exceeded the wages of industrial workers in the province by 34.2%, and these ratios almost coincide with the average ratios for 1922/23, when the earnings of workers in the capitals exceeded the earnings of workers in the province by 33%. In the first quarter of 1923/24, the discrepancy in earnings increased noticeably, in the second and third quarters, the earnings of workers in the capitals and provinces became somewhat closer, since the real earnings of workers in the province, under the influence of the convergence of the timing of calculating wages and paying it in the second quarter and as a result of the transition to calculating salaries in red rubles in the third quarter, increased. However, in the fourth quarter, the discrepancy between the earnings of workers in the capitals and the provinces is again increasing and reaches 35%. A similar quarterly trend can be noted in the metalworking and textile industries, and the discrepancy between the earnings of workers in the capitals and provinces in the metalworking industry exceeds the average discrepancy for the entire industry, while in the textile industry this discrepancy lags far behind the average for the entire industry (possibly due to the low earnings of textile workers). Let's estimate the level of differentiation of salaries of industrial workers based on their grouping by the size of earnings in conditional Moscow and red rubles. Table 13. Distribution of workers by earnings in March 1924 (the table is compiled according to [17, p. 642]) | In conditional Moscow rubles | In red rubles | | Grouping | Received as a % of the total | Grouping |
Received as a % of the total | | Up to 10 rubles . | 14,0 | Up to 20 rubles . | 19,9 | | From 10.1 to 20 rubles . | 42,8 | From 20.1 to 30 rubles . | 23,2 | | From 20.1 to 30 rubles . | 25,3 | From 30.1 to 40 rubles . | 20,0 | | From 30.1 to 40 rubles . | 12,1 | From 40.0 to 50 rubles . | 14,2 | | From 40.1 to 50 rubles . | 3,24 | From 50.1 to 60 rubles . |
8,8 | | From 50.1 to 60 rubles . | 1,8 | From 60.1 to 70 rubles . | 5,6 | | Over 60 rubles . | 0,8 | From 70.1 to 80 rubles . | 6,7 | | | | Over 100 rubles . | 1,6 | Calculating the inequality coefficients based on these data gives fairly close values of the Gini coefficients for the data in Moscow rubles and in red rubles: respectively, 0.29 and 0.30, while the decile coefficients differ significantly – 5.12 and 7.25, i.e. the differentiation in red rubles is noticeably higher. For 1924, Gini = 0.26, decile coefficient = 3.4 For comparison, we present data on the distribution of workers in large-scale factory industry by earnings in March 1925 and 1926. Table 14. Distribution of workers in large-scale factory industry by earnings in March 1925 and 1926. (in red rubles) (the table is based on the materials [18, p.289]) | Grouping | Received as a % of the total | | March 1925 | March 1926 | |
Up to 30 rubles . | 30,6 | 15,8 | | From 30.1 to 40 rubles . | 21,8 | 15,6 | | From 40.0 to 50 rubles . | 17,2 | 16,9 | | From 50.1 to 60 rubles . | 11,1 | 14,3 | | From 60.1 to 70 rubles . | 7,0 | 10,4 | | From 70.1 to 80 rubles . | 4,4 | 7,8 | | From 80.1 to 90 rubles . | 2,8 | 5,7 |
| From 90.1 to 100 rubles . | 1,8 | 4,1 | | From 100.1 to 150 rubles . | 2,9 | 8,0 | | Over 150 rubles . | 0,4 | 1,4 | During the transition from 1925 to 1926, the decile coefficient decreases from 7.4 to 4.3; the Gini coefficient increases slightly – from 3.9 to 4.0. Turning to the review of the dynamics of wages of industrial employees, it should be noted that the increase in real wages of employees on average throughout the industry in general almost did not lag behind the corresponding increase in earnings of industrial workers. If we compare the real monthly earnings of industrial employees in the fourth quarter of 1923/24 with earnings in September 1923, then the wage increase for this period will be expressed in 27.5% (relative to the cost of budget recruitment). In the capitals, the real wages of employees in industrial enterprises exceeded the salaries of industrial employees of the province by 19.2%, that is, the lag between the salaries of provincial employees and those in the capitals was less significant than that of industrial workers. The earnings of employees in industrial enterprises exceeded the earnings of workers on average throughout the industry in 1923/24 by 86%; a more significant discrepancy between the earnings of employees and workers was in the textile industry, in which the wage level of workers is relatively low. On the contrary, in industries where workers' wages are relatively high, for example, in the printing industry, employees' earnings were already much less different from workers' earnings. In Moscow, the earnings of industrial employees exceeded the earnings of workers by 77%. The nominal earnings of industrial employees in red rubles in July – September 1924 reached an average of 72.2 rubles in the union, in Moscow it exceeds 100 rubles, and in Leningrad it is 89 rubles. Although fluctuations in the average earnings of industrial employees were relatively insignificant for individual unions, but within the group of industrial employees itself, which includes, along with senior technical and administrative personnel, average technical and office staff and even unskilled employees, we find a very pronounced differentiation of earnings. Thus, according to the salary survey for March 1924, the grouping of employees of industrial enterprises by the size of earnings on average throughout the industry (53 thousand employees of industrial enterprises were included in the calculation) was as follows: Table 15. Distribution of industrial employees by earnings in March 1924 (the table is compiled according to the data of the article [17, p. 652]) | In conditional Moscow rubles | In red rubles | | Grouping |
Received as a % of the total | Grouping | Received as a % of the total | | Up to 10 rubles . | 2,3 | Up to 20 p . 4,1 | 4,1 | | From 10.1 to 20 rubles . | 16,4 | From 20.1 to 40 rubles . | 20,8 | | From 20.1 to 30 rubles . | 28,8 | From 40.1 to 60 rubles . | 29,7 | | From 30.1 to 40 rubles . | 22,1 | From 60.0 to 80 rubles . | 18,0 | |
From 40.1 to 50 rubles . | 10,4 | From 80.1 to 100 rubles . | 11,0 | | From 50.1 to 60 rubles . | 6,9 | From 100 to 125 rubles . | 7,0 | | Over 60 rubles . | 13,1 | From 125 to 150 rubles . | 4,2 | | | | Over 150 rubles . | 5,2 | Calculating the inequality coefficients based on these data gives fairly close values: the Gini coefficients for the data in Moscow rubles and in red rubles give, respectively, 0.26 and 0.30; decile coefficients – 4.24 and 4.78. These results show a fairly noticeable level of wage differentiation during the process of a gradual return to normal wage principles, although the indicators for employees are lower than for workers. To characterize the dynamics of wages of Soviet employees united by the union of state workers, we use data on metropolitan and provincial institutions, which are cited by A. G. Rashin [17, p.654]. Accordingly, due to the lack of information about county institutions with lower salaries, the salaries of state employees calculated in the table are somewhat overstated. Table 16. Average monthly earnings of Soviet employees in 1923/24 | |
In conditional Moscow rubles. | | 1st quarter | 2nd quarter | 3rd quarter | 4th quarter | On average per year | 1923/24 to 1922/23 | | Total for the USSR | 31,56 | 30,73 | 28,95 | 31,61 | 30,71 | +38,3 | | Including | | |
| | | | | Moscow | 46,88 | 48,12 | 37,21 | 39,13 | 41,58 | +26,2 | | city of Leningrad | 37,00 | 37,75 | 33,80 | 36,22 | 36,19 | +32,5 | | Province |
27,22 | 26,90 | 26,30 | 29,06 | 27,37 | +40,9 | A significant increase in the real wages of Soviet employees should be noted in the first quarter during the transition to the new budget year. In the second and third quarters, there was a slight decrease in real wages, and in the fourth quarter, the wages of Soviet employees reached the level of the first quarter again. If we compare real wages on average for 1922/23 and 1923/24, it increased by 38%. A. A. Ilyukhov notes that in 1923/24, statistics show not only a tendency to increase wages, but also its rather unstable state (both throughout industry and in Moscow). He sees the reasons for this instability in fluctuations in prices on commodity markets, in high inflation, in the system of calculating real wages, in the number of days worked and other factors [1, p.99]. Since 1922/23, there has been a process of reducing the share of the natural part of wages, which gradually came to naught in 1924 at enterprises of all types. However, although by the beginning of 1924 wages began to be issued only in cash, the state sometimes used in-kind payments, but no longer to pay for specific labor, but to pay for utilities and (or) food. These payments were added to the salary, although they did not depend on its size. This mainly concerned payments for occupied premises – as state support for socially privileged segments of the population. The natural payment during the NEP period gradually decreased and amounted to 8.5% in 1924 [1, p.72]. Thus, during 1923/24, a further and rather significant increase in wages continued, and in some branches of labor it occurred especially intensively. During the year, wages increased for industrial workers by 30.7%, for industrial employees by 32.5% and for Soviet employees of provincial institutions by 38%. The most noticeable trend is a constant increase in real earnings for the capitals, where the wage level was significantly higher than the national average. At Moscow enterprises, workers and employees were paid mainly in monetary terms and the percentage of in-kind payments was so insignificant that it played practically no role, since by the beginning of 1924 in Moscow, in-kind salary payments had practically disappeared. Moscow is characterized by very high wage growth rates, especially since the summer of 1924, and a different wage structure. Here, already in December 1922, the monetary part of the salary was 94.5% (in January of the same year – only 37.8%), while in Petrograd it was 88%, and the national average was only 72.1% [12, pp.224-225]. Already in the summer of 1924, the wages of Moscow workers exceeded the pre-war level. This happened a little earlier among food workers, tanners, garment workers, later among textile workers, only Moscow metalworkers did not reach the size of 1913 in terms of salary in 1924. (this happened only at the beginning of 1925) Such a lag was due to the fact that before the revolution metalworkers received higher wages compared to the same garment workers and tanners, so it was difficult for them, even with high rates of wage growth, to reach the pre-revolutionary salary level. In addition, metalworkers produced less liquid goods than textile workers and tanners, which was important in a resurgent market economy. For example, printers and tanners were much ahead of the salaries of textile workers and garment workers, which is explained by the high demand for their products on the market. Nevertheless, the percentage ratio of the monetary part of wages to all earnings in Moscow and the Russian province was noticeably different – provincial workers even in April 1923 received a quarter of their earnings in rations (A. G. Rashin explains this situation by money starvation in the province). Thus, in the first half of the 1920s, various periods of salary dynamics can be distinguished: from almost complete naturalization and the dominance of equalization, through rapid and disordered growth of nominal and real wages under the influence of many factors - to a decrease and cancellation of in–kind payments and the beginning of a return to normal principles of remuneration.
References
1. Ilyukhov, A.A. (2010). How the Bolsheviks paid: The policy of the Soviet government in the field of wages in 1917–1941. Moscow: ROSSPEN.
2. Strumilin, S.G. (1923). Wages and labor productivity in Russian industry for 1913–1922. Moscow.
3. Prokopovich, S.N. (1952). National economy of the USSR. Vol. II. New York: Chekhov Publishing House.
4. Strumilin, S.G. (1964). Selected works. In 5 vols. Vol. 3. Problems of labor economics. Moscow: Nauka.
5. Garskova, I.M. (2022). Dynamics of wages inequality in soviet industry in the nep years: a comparative analysis. Ural Historical Bulletin, 1, 38–50.
6. Sokolov, A.K. (2000). Soviet policy in the field of motivation and stimulation of labor (1917-mid-1930s) In: L. Borodkin (ed.), Economic history. Review, 4, 39–80. Moscow: MSU.
7. IV Congress of Trade Unions: Verbatim report (1921). Vol. 2. Moscow.
8. Borodkin, L.I., Safonova, E.I. State regulation of labor relations during the NEP: the formation of a system of labor motivation in industry, Economic history. Review, 5, 23-46. Moscow: MSU.
9. Statistical yearbook. 1921 First issue. With the addition of information for 1922 on foreign trade (1921). Vol. VIII. Moscow: Central Statistical Office.
10. Labor statistics in industrial establishments. Work attendance, absenteeism and workers' wages in 1920 (1922). Vol. XI. Moscow: Central Statistical Office.
11. Pollyak, G.S. Cash wages of factory workers and employees in 1921. (1923). In: Labor statistics in industrial institutions. Movement of labor, attendance at work, absenteeism and wages of workers in 1921. Vol. XI. Moscow: Central Statistical Office.
12. Statistical yearbook. 1922 and 1923. First issue (1924). Vol. VIII. Moscow: Central Statistical Office.
13. Statistical yearbook. 1924 First issue (1926). Vol. VIII. Moscow: Central Statistical Office.
14. Rashin, A.G. (1923). Movement of wages in 1922. In: National Economy of Russia for 1921–1922. Statistical and economic yearbook (pp. 190-218). Moscow: Publishing House “Economic Life”. – P. 190–218.
15. Pollyak, G.S. (1927). Worker’s budget in 1922–1926. Economic Review, X (pp. 169–186).
16. Pollyak, G.S. (1924). Budgets of workers and employees. In: National Economy of the USSR for 1923–24 (IV Statistical and Economic Yearbook). Moscow: Economic Life (pp. 658–678).
17. Rashin, A.G. (1924). Wages. In: National Economy of the USSR for 1923–24 (IV Statistical and Economic Yearbook). Moscow: Economic life (pp. 634–657).
18. Statistical reference book of the USSR, 1927 (1927). Moscow.
Peer Review
Peer reviewers' evaluations remain confidential and are not disclosed to the public. Only external reviews, authorized for publication by the article's author(s), are made public. Typically, these final reviews are conducted after the manuscript's revision. Adhering to our double-blind review policy, the reviewer's identity is kept confidential.
The list of publisher reviewers can be found here.
The study of inequality, including the principles and tools for measuring it in different historical periods, has been one of the most relevant areas of economic history over the past decades. In this regard, the period of the NEP, when the foundations of the Soviet economy were laid, is of particular interest to Russia. At the same time, for the first half of the 20th century. One of the most difficult issues remains the dynamics of the natural and monetary parts of the salaries of workers and employees. This is the problem that the reviewed article is devoted to. The methodology of the article consists in a comparative analysis of two main components of wages – monetary and in-kind. At the same time, it is noted that during the period under review, it was the natural part of wages (rations) that provided the vital needs of workers. Statistical indicators such as the coefficient of variation and econometric indicators such as the decile coefficient and the Gini index are used to calculate the distribution of wages by territorial units – provinces. The relevance of the article is determined by the relentless and ever-increasing interest in the problems of inequality in both world and domestic science. The study of wage inequality in the history of our country has a special specificity and great importance due to the peculiarities of tax taxation (the absence of an income tax collection system at the time under consideration). The scientific novelty of the work lies in the analysis of statistical materials for a large number of provinces on the basis of a representative source complex, as well as the use of modern methods of material analysis. The structure of the article is completely subordinated to the logic of the study of the presented statistical material. The presentation begins with the statement of the problem. It is noted that during the civil war, the principle of equalization in wages completely prevailed, and during the NEP period, a return to the principles of differentiated wages began. In the second half of the 1920s, there were various trends in wages. The period of early NEP is considered in detail, when the salary was based on in-kind payments. At a later time, an increase in the share of piecework payments contributed to an increase in the monetary part of wages, which is clearly noticeable, starting in 1921. Speaking about the ratio of salaries of workers and employees, the author notes an increase in this difference in favor of employees. The wages of workers and employees grew most confidently in the capitals. The general conclusion is that by the mid-1920s there was a return to normal principles of remuneration. The work is written in a strict scientific style, is subject to strict logic and is distinguished by a clear argumentation of the propositions expressed. The bibliography of the article contains literature and sources related to the subject and chronology of the reviewed article, covering the entire issue fairly evenly. The reviewed work contains a number of new questions, which, of course, will contribute to the development of discussions and high citation of the article. The article devoted to the dynamics of the monetary part of labor and the differentiation of its payment in the first half of the 1920s is a high-level scientific text and can be recommended for publication.
Link to this article
You can simply select and copy link from below text field.
|
|