|
MAIN PAGE
> Back to contents
Historical informatics
Reference:
Zhukov D.S., Kanishchev V.V., Lyamin S.K.
Modeling of demographic processes in the Tambov and Tver regions (1989 – 2020)
// Historical informatics.
2023. № 1.
P. 37-54.
DOI: 10.7256/2585-7797.2023.1.40097 EDN: OPXKFA URL: https://en.nbpublish.com/library_read_article.php?id=40097
Modeling of demographic processes in the Tambov and Tver regions (1989 – 2020)
Zhukov Dmitry Sergeevich
PhD in History
Associate professor, Derzhavin Tambov State University
of. 316, 33, Internatsional'naya ul., Tambov, Tambovskaya oblast', Russia, 392000

|
ineternatum@mail.ru
|
|
 |
Other publications by this author
|
|
Kanishchev Valery Vladimirovich
Doctor of History
Professor, Derzhavin Tambov State University
33, ul. Internatsional'naya, g. Tambov, Tambovskaya oblast', Russia, 392000
|
|
valcan@mail.ru
|
|
 |
Other publications by this author
|
|
|
Lyamin Sergey Konstantinovich
PhD in History
Associate professor, Derzhavin Tambov State University
33 Internatsional'naya ul., Tambov, Tambovskaya oblast', Russia, 392000
|
|
laomin@mail.ru
|
|
 |
Other publications by this author
|
|
|
DOI: 10.7256/2585-7797.2023.1.40097
EDN: OPXKFA
Received:
01-04-2023
Published:
25-04-2023
Abstract:
The aim of the study is to reconstruct the demographic strategies of rural societies. The object of the study is individual settlements and village councils (groups of settlements) of the Tambov and Tver regions (a total of 2861 settlements and 371 village councils). The presented work is undertaken within the framework of a large project on fractal modeling of demographic strategies of the agrarian population of European Russia in a long historical retrospective – since the middle of the XIX century. The chronological framework of the article covers not only the agricultural crisis of the 1990s, but also a certain recovery of some rural settlements in the 2000s - 2010s. To conduct experiments with the proposed computer model, a database was created in which the main parameters of the studied settlements and village councils are presented in a formalized form. The authors conclude that, despite all the differences, the demographic strategies of Tver and Tambov settlements evolve within the same pattern: Tver and Tambov regions are simply in slightly different phases of the same process. Peasant society in the Tver region has less potential as a migration donor and a base for natural growth. The older and northern Tver Region has been following the path of de-settlement and urbanization for a longer time. Tambov peasant society is somewhat less depleted and, therefore, could demonstrate great demographic success in the case of a successful demographic policy.
Keywords:
fractal modeling, historical demography, demographic strategies, rural population, Tambov region, Tver region, migration, birth rate, death rate, demographic factors
This article is automatically translated.
You can find original text of the article here.
IntroductionThe subject of the study is intersubjective demographic strategies of peasant microsociums of the Tambov and Tver regions. 1,574 individual settlements in the Tambov Region in 1989 – 2010, 1,290 settlements in the Tver region in 2002 – 2010, as well as 225 village councils (groups of settlements) in the Tambov Region and 146 village councils in the Tver Region in 2010 – 2020 were studied. The work is a continuation of a large research process on fractal modeling, which previously covered several time periods from the middle of the XIX to the last decade of the XX century. The project is based on both historical and demographic subject surveys of Russian and foreign studies [1; 2; 3; 4; 5; 6], as well as the latest methodological initiatives in the field of modeling and interdisciplinary dialogue [7; 8; 9; 10]. This article is a direct continuation of our publication in Historical Informatics, devoted to the demographic intentions of the Tambov peasantry in 1959-1989 [11]. In addition to objective socio-economic factors, intersubjective factors also affect demographic processes. As previous studies have shown, such a strategy can change, We consider such strategies as “ideal". Their study is important for understanding not only existing, but also unrealized demographic processes and phenomena [11]. To reconstruct such an elusive subject as intersubjective strategies, we used the Demofractal model, which is a variation of the general fractal transition model (OFMP). The Demofractal model was previously used by us to study the strategies of rural settlements in the Tambov region for several periods, starting from the middle of the XIX century and ending in 1989 [11; 12; 13; 14; 15]. In this article, an attempt is made to compare the chernozem, largely agrarian Tambov region with the non–chernozem, mainly non-agricultural region - Tver. The cluster analysis conducted earlier on the main demographic indicators as of 2002 revealed that the Tambov and Tver regions are united into one group (together with other regions with a Russian population) relatively late – at the sixth step out of eight [16]. Cluster analysis of 2020 data showed that two regions joined a single cluster with most of the regions of the Center of Russia at the 4th step, with a minimum binding distance [17]. Such results indicate that the settlements of the two regions under consideration belong to the types that collectively (although with some reservations) cover most of the regions of Central Russia, including the Upper Volga region [18, pp. 219-220]. Chronologically, the article is devoted to the first post-Soviet decades, which contained not only the agricultural crisis of the 1990s, but also a certain restoration of some rural settlements in the 2000s – 2010s. To conduct computer experiments with Demofractal, a database was created in which the main parameters of the studied settlements and village councils (groups of settlements) are presented in a formalized form. The sources for this database are a variety of statistical and reference materials. First of all, we were based on the primary settlement data of the All-Russian population censuses of 1989, 2002 and 2010 [19; 20; 21]. Since the settlement data of the 2020 All–Russian population census has not yet been published, for 2010-2020 we decided to build a model based on demographic data of individual village councils for the period we are interested in. These data have already been posted on the Rosstat website. We also used official Internet resources of administrations of different levels to collect data. In the 2000s and 2010s, reports of village councils began to be posted on the Internet, containing important information about the demographic and socio-economic state of settlements. The mathematical apparatus of OFMP used by us [11] is based on B. Mandelbrot's procedures for constructing algebraic fractals [22]. The General fractal Transition Model (OFMP) represents the evolution of the system as the movement of an image point in a two-dimensional phase space, which we have explained more than once in our works [11; 12; 13; 14; 15]. Simulation results for the years 1989 – 2010: general characteristicsAs we noted at the beginning of the article, new modeling experiments were conducted on the materials of 1574 individual settlements in the Tambov region and 1290 settlements in the Tver region in 1989 – 2010. For all these settlements (or groups of settlements), control factors were calculated based on indicators. Indicators for each settlement are collected in a database available online on the website of the Fractal Modeling Center: http://ineternum.ru/demo-tambov2010 /, http://ineternum.ru/demo-tver2010 /, http://ineternum.ru/demo-2010 /. The main trend of changes by the end of the period under review is the improvement of the technical and technological equipment of society, which led to an increase in the importance of factor A (favoring the external environment). In addition, the large-scale crisis of the 1990s was compensated in some settlements by the active economic development of the 2000s. At a minimum, we can talk about the recovery growth, which, however, in those years did not have time to have a decisive impact on the restoration of the destroyed and the creation of a fundamentally new rural socio-economic infrastructure.
Therefore, in general, the indicators and formulas for calculating control factors adopted for the model of 1959-1989 have remained the same in the model [11]. Factor A in the new model was increased to 0.31 (from 0.30). This is a tangible, though not radical, growth. In addition, the initial data on settlements have changed. The average value of D c for settlements in the Tambov region increased from 0.7921 to 0.8920 compared to the previous period, the average K c – from 1.6182 to 1.7308. The average values for the Tver region were: D c = 0.8512; K c = 1.7302. The preceding period of 1959 – 1989 was not considered in the Tver region. Although the average values may hide significant disproportions in the distribution of values of control factors by settlements, it can be stated that, in general, the regulators of migration trends and natural growth of the modernized type have strengthened. Objective migration factors and intersubjective migration intentions in the model strongly influence demographic strategies, namely, the desired amount of demographic growth. We assume that migration (both incoming and outgoing) significantly changes the possibilities and intentions of people in terms of fertility. The evolution of demographic behavior under the influence of migration factors clearly splits into two phases, which are separated from each other by a qualitative leap, which we conditionally designated in previous publications as a demo-migration turn (DMP). Recall that in the early stages of the exit of the Russian rural community from the traditional state (1930s – 1950s), the outflow of population stimulated the intention to fertility, since society suffered from the loss of the number of workers and guardians. This is the reaction of a society that "remembers" about traditional, compensatory, collective survival strategies. Thus, in the early stages, society aspired to a certain ideal state on the principle of "a lot of people are born, but they all leave." However, the intention to fertility, as we have seen, at that time could not be fully realized in practice and have real results in the form of natural population growth in the vast majority of settlements. Migration intentions were carried out much more easily than the desire for fertility. Migration losses undermined the number of young people of fertile age. Moreover, preparation for migration, relocation, adaptation to a new place led to the postponement of births and a reduction in their number. At the same time, the saturation of society with newly arrived migrants did not sufficiently affect the birth rate. It took some time for migrants to adapt. In addition, as the study of demographic "conservative modernization" shows, migrants to rural areas were often "aged" people who returned to their native lands [23]. After the completion of the VMP (for most settlements around the 1980s - 2000s), the rural community began to respond to increased migration incentives by reducing the desire for fertility and, paradoxically, reducing the intentions for outbound migration to zero and then to positive values. The last statement seems paradoxical. In reality, migration factors in the Russian countryside increased following the improvement of the quality of life, an increase in labor productivity and competencies (and hence life options) of residents. When leaving the traditional state, these factors pushed the population out of the village, and in the modernized phase, they tempered the incentives to move. The vector in this phase is aimed at achieving an ideal state according to the principle "no one is born, but many come". Thus, DMP is associated with the termination of the traditional social mechanisms of collective survival and with a qualitative leap in the standard of living and its technical and technological conditions. From striving for a society of ideal demographic donors, society turns to a strategy of ideal migration recipients. However, as modeling has shown, modern rural settlements, after they have passed the DMP and changed the vector of evolution, do not rush directly to becoming "migration hubs", but gravitate to the point of balance. This means that they are striving for a noticeable natural increase (although smaller than before the DMP), which exceeds the insignificant migration outflow. This is the condition of healthy migration donors (with families of about three children) who are able to maintain their numbers stably. The main "danger" for such a positive scenario is the unbalanced growth of migration sentiment and incentives in both donor and hub settlements. In this case, donor settlements can switch to strategies with a natural decline and disappear against the background of even a small outflow. Hub settlements will also generate a natural decline, maintaining their numbers by pulling the population out of donors. Practical socio-political efforts, from the point of view of the model, should be aimed at regulating migration factors in order to achieve higher (in terms of population growth) ratios of natural growth and migration loss. The point of application of forces in this case should be precisely migration sentiments and the factors forming them. Positive scenarios arise if the growth of objective circumstances contributing to migration is moderated, and intersubjective migration intentions are minimized. The impact of migration factors on the demographic strategy of the rural population of the Tambov region was formally described in the model for the previous stage of 1959 – 1989. In that paper, we theoretically predicted the presence of DMP. We could not observe it fully in those years, since only 13 settlements demonstrated an "explosion" of attractors, but experiments with hypothetical scenarios showed DMP [11]. Simulation results for 1989 – 2010 for settlements of the Tambov region
Figure 1 shows a composite picture of the attractors of 750 settlements in the Tambov region (the "explosions" of the attractors are not depicted here). 
Figure 1. Attractors of 750 separate settlements, Tambov region, 1989 – 2010. One settlement corresponds to one point. (Figure 1. Attractors of 750 individual settlements, Tambov region, 1989 - 2010. One settlement corresponds to one point). A comparison of the general modeling results (belonging of settlements to different types of demographic strategies) for the years 1959 – 1989 and 1989 – 2010 is presented in Table 1 (for the Tambov region). Table 1. Comparative modeling results for 1959 – 1989 and 1989 – 2010, demographic strategies, Tambov region. (Table 1. Comparative modeling results for 1959 - 1989 and 1989 - 2010, demographic strategies, Tambov region). | | 1959 – 19891989 – 2010 | number of settlements, units. | | % | number of settlements, units. | % | TOTAL of them related to the type: | | 1544 | 100 | 1574 | 100 | | N (EpMu)/1 – natural growth does not compensate for migration loss | total (EpMu)/11400 | | 90,7 | 1360 | 86,4 | | including in the risk zone of desolation (Z) | 975 | 63,1 | 993 | 63,1 | | N (EpMu)/2 – natural growth compensates and covers the migration loss | 5 | 0,3 | 73 | 4,6 | | M (ePMP)/3 – natural growth is greater than migration growth. | 5 | 0,3 | 33 | 2,1 | | M (ePMP)/4 – migration growth is greater than natural growth | 36 | 2,3 | 34 | 2,2 | | O (EuMp)/5 – migration growth compensates and covers the natural decline | 40 | 2,6 | 36 | 2,3 | | O (EuMp)/6 – migration growth does not compensate for natural decline | 29 | 1,9 | 8 | 0,5 | | T (EuMu)/7 – migration decline is less than natural decline | 12 | 0,8 | 5 | 0,3 | | T (EuMu)/8 – migration decline is greater than natural decline | 17 | 1,1 | 25 | 1,6 |
In most cases, the shares of different types have not changed radically. However, there are a few exceptions. A significant number of settlements appeared in types 2 and 3. This is a sign of demographic rebirth, since there is a natural increase in these types, which exceeds the migration increase or decrease. Earlier (in 1959 – 1989), only ten such settlements were recorded, and in the studied period – 106. Most of them (73 settlements) are located in region 2 (migration donors compensating for losses due to good natural growth). Figure 2 shows that the attractors in region 2 are a continuation of the elongated cloud of attractors, which we have designated as the "upper cluster". It is located in regions 1 and 2. Below we will show that the attractors in region 2 obviously appeared here as a result of the flow of attractors inside this cloud from region 1. This means that the settlement is gradually moving from a situation where the migration outflow depletes local communities to a situation where the outflow becomes less than the natural increase. The share of settlements of types 2 and 3 in the total number of settlements is small, so Table 1, in general, records, at first glance, the continuity of processes in a later period. However, as we will show below, the difference between the two periods has a deep – qualitative - character. Demographic strategies have undergone a dramatic change during this time. We will focus on the changes that occurred within types 1 and 2. Figure 2 and Table 2 show the distribution of clusters of attractors. Figure 2 does not indicate settlements in the state of "explosion" of attractors. Examples of such settlements are given in Figure 3. 
Figure 2. Clusters of attractors, Tambov region, 1989 – 2010: v – "upper cluster" of attractors, s – "middle cluster", n – "lower cluster". Arrows indicate the movements/evolutions of attractors in clusters under the influence of growth factors A and D c. (Figure 2. Clusters of attractors, Tambov region, 1989 - 2010: v - "upper cluster" of attractors, s - "middle cluster", n - "lower cluster". The arrows indicate the displacements/evolutions of attractors in clusters under the influence of the growth of factors A and Dc). Table 2. Simulation results for 1989 – 2010, clusters of attractors, Tambov region. (Table 2. Simulation results for 1989 - 2010, clusters of attractors, Tambov region). | demographic strategy of settlementsnumber of settlements, units. | share of the total number of settlements, % | in the risk zone of desolation (Z), but not experiencing an "explosion of attractors" | | 169 | 10,7 | | "explosion of attractors" in zone Z | 824*52,4 | | | in the "middle and lower clusters" outside the Z zone in region 1 | 214 | 13,6 | | in the "upper cluster" in areas 1 and 2 | 226 | 14,4 | * In the model for 1959-1989, the number of settlements experiencing an "explosion of attractors" was significantly less – 13 units.Figure 3. "Explosion" of attractors, examples, Tambov region. 
Each image inside the drawing corresponds to one settlement, which is characterized by a variety of attractors. (Figure 3. "Explosion" of attractors, examples, Tambov region. Each image corresponds to one settlement, which is characterized by a set of attractors). In our previous work, we showed that the "explosion" of attractors in the Z zone is a turning point for settlements [11]. It is associated with a high risk of the disappearance of settlements (due to the highest migration intentions), but at the same time, the vector of evolution changes at this moment, and the surviving settlements, having passed the DMP, get a chance to reduce outflow and balance it with natural growth. We associate the explosion of attractors in the Z-zone with precisely the DMP. If in 1959 – 1989 there were only 13 settlements in the Tambov region in a state of explosion of attractors, then in 1989 – 2010 there were 824 such settlements. Thus, more than half of the settlements were in the acute phase of DMP. The "lower", "middle" and "upper" clusters of attractors (Figure 2) are settlements that have already passed the DMP and rushed to some area around the point of balance between different types of strategies (in the center of the phase space in Figure 2) We were convinced of this by increasing the values of A and Dc in several predictive experiments. As a result, the attractors moved down and to the right. That is, the clusters that we see are a manifestation of the flow of attractors into types 3, 4, 8 (and possibly into other types) under the influence of the growth of factor A and D c. It should be noted that the growth of A and D c is a consequence of an increase in the standard of living, the development of technology and technology, improved education and accessibility of infrastructure, increased options for life trajectories. These are basic historical trends. The settlements of the upper cluster (226 units) rushed after the DMP to zones 2 and 3, which are characterized by natural growth exceeding the migration outflow or inflow. The settlements of the middle and lower clusters (214 units) evolved towards types 8 and 7, where there is a natural and migratory decline. However, clusters are located near the balance line, which means that settlements tend to balance migration and natural processes. This means that the demographic situation is amenable to adjustment. 169 settlements remained in the risk zone of desolation, which have not yet joined the DMP. Thus, we can observe a picture when a small part of the settlements (about 11%) is only being drawn into the DMP, more than half of the settlements are experiencing its acute phase. About 14% of settlements have passed/survived the DMP and are evolving in the direction of demographic revival. Another 13.4% after the DMP are evolving in the direction of demographic balance, but with a slight predominance of migration outflow, which gives hope for the possibility of adjusting their demographic strategy. We can say that in the 1989 – 2010 model for the Tambov Region, we see a massive finale of trends that manifested and became dominant in the 1939 – 1959 and 1959 – 1989 models, as well as the start of new trends. The model gives hope for the scrapping of negative and the emergence of positive trends. However, the fact that the continued existence of more than half of the settlements remains in question, of course, does not allow us to make rosy forecasts. Simulation results for 2002 – 2010 for settlements of the Tver region
Modeling strategies of Tver settlements shows that they (in terms of demographic intentions) evolved similarly to the settlements of the Tambov region. Figure 4 shows a composite picture of the attractors of 391 settlements of the Tver region (the "explosions" of the attractors are not depicted here as well as in Figure 1). 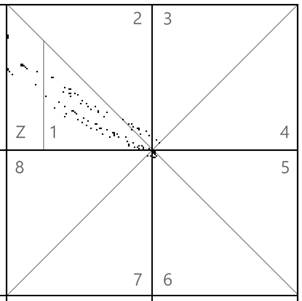
Figure 4. Attractors of 391 separate settlements, Tver region, 1989 – 2010. One settlement corresponds to one point. (Figure 4. Attractors of 391 individual settlements, Tver Oblast, 1989 - 2010. One settlement corresponds to one point). Having passed the early phase of the DMP (which we do not see during this period), settlements fall into the risk zone of desolation and experience an "explosion" of attractors (most of such settlements in the Tver region, as in the Tambov region). As already mentioned, we identify the "explosion" of attractors with the DMP. Examples of attractor explosions in Tver experiments are shown in Figure 5. Those settlements that have survived the DMP will further evolve along the trajectory from the Z zone down and to the right – in the vicinity of the point of balance between migration and natural increase/decrease (that is, to the center of the model space in Figure 4). Such settlements that have emerged from the DMP make up the upper and lower clusters of attractors (Figure 4). The difference between the Tver experiments and the Tambov ones (Figure 2) is that there are two clusters instead of three and, accordingly, the overall picture of the flow of attractors (evolution of settlements) is somewhat simpler. 
Figure 5. "Explosion" of attractors, examples, Tver region. The figure shows the numbers of those experiments for which the presented "explosions" of attractors are typical. (Figure 5. "Explosion" of attractors, examples, Tver region. The image contains the numbers of those experiments for which the presented "explosions" of attractors are typical). The sizes of the attractor clusters differ somewhat in the Tambov and Tver experiments, which gives some grounds for conclusions about the pace and completeness of processes in the Tver region compared to the Tambov region. Table 3 allows you to compare the size of clusters and the number of attractors in the Z zone. Table 3. Simulation results for the Tambov and Tver regions, clusters of attractors, 1989 – 2010. (Table 3. Simulation results for the Tambov and Tver regions, clusters of attractors, 1989 - 2010). | Demographic strategy of settlementsTambov region . | Tver region . | number of settlements, units. | | share of the total number of settlements, % | number of settlements, units. | share of the total number of settlements, % | in the risk zone of desolation (Z), but not experiencing an "explosion of attractors" | | 169 | 10,7 | 138 | 10,7 | | "explosion of attractors" in zone Z | 824 | 52,4 | 899 | 69,7 | | in the "middle and lower clusters" outside the Z zone in region 1 | 214 | 13,6 | 77 | 6,0 | | in the "upper cluster" in areas 1 and 2 | 226 | 14,4 | 145 | 11,2 | As can be seen from Table 3, there are 17.3% more settlements in the Tver Region that are "stuck" in the risk zone of desolation and experiencing an "explosion" of attractors. At the same time, the size of the "clouds" in the Tambov region is 10.8% larger. The Tver region, which is part of the "staropakhotny" Center of Russia and is located north of the chernozem Tambov region, has experienced the processes of urbanization and de-farming earlier and more strongly. The settlements of the Tver Region have therefore moved much further along the path that the Tambov settlements are following. The migration and demographic potential of Tver settlements is severely depleted: there are more settlements on the verge of desolation (in zone Z). Settlements included in clusters have relatively positive demographic prospects and are moving, under favorable circumstances, towards balanced development. In the Tver region, the share of such settlements is less compared to the Tambov region. Peasant society has already played a powerful role in filling migration hubs and is largely exhausted. It should be assumed that some of the successful settlements in the Tver region have long grown to the level of cities and urban-type settlements (pgt) and therefore were outside the scope of our study.
In addition, large villages in the Tver region were less in demand as population hubs (numerous cities and villages coped with this role). Tambov region is significantly inferior to the Tver region in terms of the number of cities and urban-type settlements. With a comparable total population (1.23 million people in the Tver region and 0.98 million people in the Tambov region in 2022), the urban population of the Tver Region in 2020 was 78.1% (in the region of 23 cities and 30 villages), while in the Tambov region in 2021, citizens made up 61.5% (in the region of 8 cities and 12 pgt). A comparison of the structure of Tambov and Tver settlements by types of demographic strategies also pushes to similar conclusions (Table 4). Table 4. Modeling results for the Tambov and Tver regions, demographic strategies, 1989 – 2010. (Table 4. Modeling results for Tambov and Tver regions, demographic strategies, 1989 - 2010). | | TambovTverskaya | number of settlements, units. | | % | number of settlements, units. | % | TOTAL of them related to the type: | | 1574 | 100 | 1290 | 100 | | N (EpMu)/1 – natural growth does not compensate for migration loss | total (EpMu)/11360 | | 86,4 | 1225 | 95,0 | | including in the risk zone of desolation (Z) | 993 | 63,1 | 1037 | 80,4 | | N (EpMu)/2 – natural growth compensates and covers the migration loss | 73 | 4,6 | 34 | 2,6 | | M (ePMP)/3 – natural growth is greater than migration growth. | 33 | 2,1 | 7 | 0,5 | | M (ePMP)/4 – migration growth is greater than natural growth | 34 | 2,2 | 0 | 0,0 | | O (EuMp)/5 – migration growth compensates and covers the natural decline | 36 | 2,3 | 16 | 1,2 | | O (EuMp)/6 – migration growth does not compensate for natural decline | 8 | 0,5 | 4 | 0,3 | | T (EuMu)/7 – migration decline is less than natural decline | 5 | 0,3 | 4 | 0,3 | | T (EuMu)/8 – migration decline is greater than natural decline | 25 | 1,6 | 0 | 0 | Table 4 shows that settlements of types 2, 3, 4 and 5, which have the prospect of growth (due to migration and/or natural growth), together in the Tver region account for 4.3% (versus 11.2% in the Tambov region). In the Tver region, such settlements either moved into urban categories or turned out to be less popular places of life due to the presence of a large number of cities and villages. It is curious that in the Tver region there are no settlements of type 8 at all (migration donors with a natural decline), whereas in the Tambov region with its large peasant demographic resource there are still such settlements, although, of course, they are rapidly disappearing. Simulation results for 2010-2020 for settlements of the Tambov and Tver regionsDue to the fact that the publication of the primary materials of the 2020 population census was delayed, we decided to use data from the level of village councils, which are updated annually and posted in a comparable form on the Rosstat website, to build a new version of the Demofractal. It is clear that studying the dynamics of the rural population at this level (that is, often at the level of settlement groups) hides the features of individual settlements, and our latest experiments give slightly different results compared to previous versions of the Demofractal, which were built on the basis of individual settlements. Nevertheless, firstly, it is interesting and useful to study demographic changes at the level of rural councils as agglomerations whose population is closely connected in everyday life; secondly, the experience of studying demographic history at the Village Council level can be used for a weather study of population movement, which cannot be carried out on the materials of general population censuses. Some minor adjustments were made to the values of the indicators (used to calculate the control factors) compared to the previous stage of modeling. In the absence of accurate data, the value of the gender imbalance was set as the average for the surviving villages in the previous period (for 2010) – for the Tambov and Tver regions 6,749 conventional units.
The environmental favorability factor remained at the same level: A = 0.31 conventional units. The value showing the completeness of the demographic transition has slightly increased: for all village councils T = 1.85. Calibration of the model by reference villages showed that compared with the previous period, the importance (quality, impact on people's lives) of medical care has increased. Therefore, 0.2 conventional units were added to all indicators of the level of medical care calculated according to the methodology of the previous period. No other changes were made to the methods of calculating indicators adopted for the previous period and to the formulas for controlling factors. The experimental results are presented in Table 5 and Figures 6 and 7. Table 5. Comparative modeling results for 2010-2020. (Table 5. Comparative modeling results for 2010 - 2020). | | Tambov region .Tver region . | number of village councils, units. | | % | number of village councils, units. | % | TOTAL of them related to the type: | | 225 | 100 | 146 | 100 | | N (EpMu)/1 – natural growth does not compensate for migration loss | total (EpMu)/144 | | 19,6 | 35 | 24,0 | | in t,h, at risk of desolation (Z) | 28 | 12,4 | 16 | 11,0 | | N (EpMu)/2 – natural growth compensates and covers the migration loss | 21 | 9,3 | 14 | 9,6 | | M (ePMP)/3 – natural growth is greater than migration growth. | 2 | 0,9 | 4 | 2,7 | | M (ePMP)/4 – migration growth is greater than natural growth | 66 | 29,3 | 58 | 39,7 | | O (EuMp)/5 – migration growth compensates and covers the natural decline | 48 | 21,3 | 26 | 17,8 | | O (EuMp)/6 – migration growth does not compensate for natural decline | 44 | 19,6 | 8 | 5,5 | | T (EuMu)/7 – migration decline is less than natural decline | 0 | 0,0 | 1 | 0,7 | | T (EuMu)/8 – migration decline is greater than natural decline | 0 | 0,0 | 0 | 0 |
Figure 6. Attractors of groups of settlements (village councils), 2010-2020, Tambov region. One village council corresponds to one point; the "explosions" of the attractors are not depicted. (Figure 6. Attractors of groups of settlements (village councils), 2010 - 2020, Tambov Oblast. One rural council corresponds to one point; no "explosions" of attractors are depicted). 
Figure 7. Attractors of groups of settlements (village councils), 2010-2020, Tver region. One village council corresponds to one point; the "explosions" of the attractors are not depicted. (Figure 7. Attractors of groups of settlements (village councils), 2010 - 2020, Tver Oblast. One rural council corresponds to one point; no "explosions" of attractors are depicted). The comparison of the results obtained with the previous period reflects, first of all, the fact that in 2010-2020 a different social and geographical object was considered. Many settlements on the verge of desolation are aggregated with prosperous neighbors and thus fell out of the field of view of this study. Village councils, compared to most individual settlements, are larger and more viable socio-geographical units with a core of one or more successful settlements and a periphery that only slightly worsens their performance. The village councils demonstrate a clear desire for an equilibrium point – most of the attractors are collected in a dense cloud in the area of the intersection of the diagonals (Figures 6 and 7). Therefore, although different types are defined for different village councils, in most cases this difference is insignificant. About half of the village councils in both regions are focused on migration inflow with moderate natural growth (type 4 + type 5) (Table 5). The pattern of behavior of migration donors (quantitatively dominant in the previous period) is typical for about a third of village councils (type 1 + type 2) (Table 5). Approximately a tenth of the village councils in both regions are at risk of desolation, but these village councils should not be considered as empty settlements, but rather as groups of settlements that are undergoing or have recently completed a DMP.
ConclusionThus, Tver and Tambov settlements demonstrate the uniformity of the pattern that governs the evolution of demographic strategies. Historical and geographical differences have determined some lag of the Tambov settlements in the implementation of the scenario according to which the situation in the Tver region is developing. At the end of the XX century, several decades after the demographic transition, the agrarian society faced the need to make a new leap – DMP (or, otherwise, disappear). If the demographic transition was associated with a huge imbalance – the gap between fertility and mortality, then the DMP was associated with an imbalance between natural increase/decrease and migration outflow. The essence of the demographic transition was a significant decrease in the birth rate to achieve a balance with mortality, which decreased as a result of general historical processes. The essence of the DMP is a significant reduction in migration outflow to balance it (in the best scenario) slightly below the natural growth. Our modeling has shown that about 14% of the 1,574 studied Tambov settlements and about 11% of Tver settlements have already reached such a trajectory. There are still opportunities to adjust to the same trajectory for about 14% of settlements in the Tambov region and about 6% in the Tver region. 4% of settlements in the Tambov region and only 0.5% in the Tver region have advanced far along this path, turning into places of attraction for migrants, but maintaining a relatively high birth rate. There is nothing surprising in the phenomenon of reverse migration to the countryside. P.G. Ryndzunsky once noted that the return movement of citizens to the land was observed in the Tver province at the end of the XIX century [24, p. 112]. In the Tambov region, V.V. Anikin noticed signs of "conservative migration" in relation to the period of the 1950s [25]. More than 52% of the settlements of the Tambov region and about 70% of the settlements of the Tver region as of 2010 are experiencing an acute phase of DMP and are at risk of disappearing without completing it. The same category includes 11% of settlements that are only being drawn into the DMP (both in the Tambov and Tver regions). At the level of village councils in both regions, more than half of the settlement groups were involved in DMP. But even in these relatively "prosperous" groups, there are village councils that face the danger of desolation. A comparative analysis of the historical and demographic development of the two regions showed that peasant society in the Tver region has less potential as a migration donor and a base for natural growth. The older and northern Tver Region has been following the path of de-settlement and urbanization for a longer time. Despite all these differences, the demographic strategies of Tver and Tambov settlements evolve within the same pattern: Tver and Tambov regions are simply in slightly different phases of the same process. Thus, the Tver Region significantly surpasses the Tambov region both in terms of the level of urbanization, and in the number of cities and urban-type settlements. Tambov peasant society is somewhat less depleted and, therefore, could demonstrate great demographic success in the case of a successful demographic policy.
References
1. Sackmann, R. (2015). How do societies cope with complex demographic challenges? A model. Coping with Demographic Change: A Comparative View on Education and Local Government in Germany and Poland. European Studies of Population, 19, 25–57.
2. Morgan, D.H.J. (1989). Strategies and sociologists: A comment on Crow. Sociology, 23(1), 25–29.
3. Peña, F.M., & Azpilicueta, M.P.E. (2003). Existen estrategias demográficas colectivas? Algunas reflexiones basadas en el modelo demográfico de baja presión de la Navarra cantábrica en los siglos XVIII y XIX. Revista de Demografía Histórica, 21(2), 13–58. Retrieved from http://www.adeh.org/?q=es/node/6402
4. Verbitskaya, O.M. (2009). Russian rural family in 1897-1959: historical and demographic aspect. Moscow: Grif and K. 295 p.
5. Zhyromskaya, V.B., & Isupov, V.A. (eds.) (2005). The population of Russia in the XX century: Historical essays. T. 3, book 1: 1960-1979. Moscow: ROSSPEN. 304 p.
6. Polyakov Y.A. (ed.) (2011). The population of Russia in the XX century: Historical essays. T. 3, book 2: 1980-1990. Moscow: ROSSPEN. 225 p.
7. Alekseev, V.V., Borodkin, L.I., Korotaev, A.V., Malinetskii, G.G., Podlazov, A.V., Malkov, S.Y., & Turchin, P.V. (2007). International Conference "Mathematical Modeling of Historical Processes". Bulletin of the Russian Fund for Basic Research, (6), 37–47.
8. Borodkin, L.I. (2005). Methodology for the analysis of unstable states in political and historical processes. International processes, 3(7), 4–16.
9. Borodkin, L.I. (2016). Modeling of historical processes: from the reconstruction of reality to the analysis of alternatives. St. Petersburg: Aleteyya Publishing House, 304 p.
10. Borodkin, L.I. (2019). Challenges of instability: concepts of synergetics in the study of the historical development of Russia. Ural Historical Bulletin, (2), 127–136.
11. Zhukov, D.S., Kanishchev, V.V., & Lyamin, S.K. (2019). Modeling of demographic processes in the late Soviet countryside: 1959-1989. Historical informatics, (4), 43–73. doi: 10.7256/2585-7797.2019.4.30639
12. Zhukov, D.S., Kanishchev, V.V., & Lyamin, S.K. (2011). Fractal modeling of historical and demographic processes. Tambov: TSU Publishing House. 195 p.
13. Zhukov, D.S., Kanishchev, V.V., & Lyamin, S.K. (2012). Fractal modeling of demographic processes in the Russian agrarian society (1926-1939). Fractal Simulation, (1), 33–60.
14. Zhukov, D., Kanishchev, V., & Lyamin, S. (2013). Fractal Modeling of Historical Demographic Processes. Historical Social Research, 38(2), 271–287.
15. Zhukov, D.S., & Kanishchev, V.V. (2019). "If there was no war": modeling of demographic processes in the Russian village in the 1930-1950s (based on the materials of the Tambov region). Bulletin of the Perm University. Series: History, (3), 118-136. doi 10.17072/2219-3111-2019-3-118-136
16. Kanishchev, V.V. (2011). Cluster analysis of the demographic behavior of the rural population of European Russia at the beginning of the 20th century and at the beginning of the XXI century. On the formulation of the question. Ineternum, (1–2), 43–55.
17. Zhukov, D.S., & Kanishchev, V.V. (2022). Cluster analysis as a means of identifying types of demographic behavior (Russian rural population, the European part of Russia, the beginning of the 20th-the beginning of the 21st centuries). Modern history of Russia, 12(2), 454-476. doi: 10.21638/11701/spbu24.2022.212
18. Kanishchev, V.V. (2016). Demographic transition in the Russian agrarian society in the second half of the 19th-the first third of the 20th centuries. Modern research methods. Yearbook on agrarian history of Eastern Europe, 2016, 210–223.
19. Population of cities and workers' settlements of the Tambov region (according to the All-Union population census of 1989): statistical collection. (1990). Tambov: TOSU. 115 p.
20. Nabiullina, E.S. (ed.) (2012). Results of the 2010 All-Russian population census. In 11 volumes. Volume 1. Number and distribution of the population. Moscow: Statistics of Russia. 1071 p.
21. All-Russian population census of 2002 [electronic resource]. Retrieved from http://www.perepis2002.ru/index.html?id=13
22. Mandelbrot B.B. (1982). The Fractal Geometry of Nature. New York: W.H. Freeman and Company. 470 p.
23. Dyachkov, V.L., Kanishchev, V.V., & Okatov, A.V. (2022). Sociological and historical aspects of migration processes in the Russian village of the XX-early XXI centuries. (On the materials of the Tambov region). Sociological research, (6), 88-100.
24. Ryndzyunsky, P.G. (1983). Peasants and the city in capitalist Russia in the second half of the 19th century: the relationship between the city and the countryside in the socio-economic system of Russia. Moscow: Nauka. 269 p.
25. Anikin, V.V. (1981). On the issue of population migration in the cities of the RSFSR in 1950-1956. Questions of history, (12), 56-65
Peer Review
Peer reviewers' evaluations remain confidential and are not disclosed to the public. Only external reviews, authorized for publication by the article's author(s), are made public. Typically, these final reviews are conducted after the manuscript's revision. Adhering to our double-blind review policy, the reviewer's identity is kept confidential.
The list of publisher reviewers can be found here.
The reviewed article is devoted to intersubjective demographic strategies of peasant microsociums of the Tambov and Tver regions. The chronological framework of the article covers the end of the XX – beginning of the XXI centuries. The article reflects the results of a broader study, which the author(s) refers to in the course of presenting the main points of the study. The sources were statistical and reference materials, primarily related to population censuses. The methodology of the article is based on an interdisciplinary approach, and more specific approaches and research methods of modern historical and demographic science, including modeling, are also used. Of particular interest to the article is the use of fractal analysis, a well–known but not very widespread technique. The article uses the Demofractal model. The relevance of the article is determined, on the one hand, by general scientific problems related to the construction of a strategy for the demographic development of the country as a whole and its individual regions. On the other hand, it is a contribution to the development of a modern "new historical demography" based on a wide range of sources and the use of methods and technologies of mathematics and computer science. The scientific novelty of the article is beyond doubt. It uses both original sources and original research methods and techniques. The author(s) develops his own research path based on the evolution of demographic behavior and the concept of a demo-migration turn (DMP). The structure of the article is generally traditional for such works. The introduction poses a problem, in particular, this is a comparison of two regions that are similar in basic demographic indicators – Tambov and Tver. The following is a brief description of the sources and methods of work with links to previous research by the author(s). After that, the results of the study for each of their two areas are presented, well illustrated with tables and figures. The general conclusion of the article is that Tambov and Tver settlements demonstrate the same patterns of development, despite differences in geographical conditions: the Tambov region is located in the Chernozem zone and is characterized by pronounced development of agriculture in contrast to the non-chernozem and non-agricultural Tver region. At the same time, the Tver Region is somewhat ahead of the Tambov region in the development of demographic trends, having less potential as a migration donor and a base for natural growth. The article is written in good scientific language and style. At the same time, it should be noted that the presented material is replete with terminology that is not familiar to every humanitarian. Therefore, a full-fledged reading and perception of the article requires some preparation. The bibliography of the work includes all the necessary sources and literature to understand the provisions of the article, it includes both Russian and foreign works. The article does not contain direct references to scientific discussions due to its methodological nature, perhaps there is a little lack of comparison of the conclusions of the study with some official provisions of the demographic policy of the state on the issues considered. The article fully complies with both the basic canons of scientific writing and the format of the journal "Historical Informatics", contains new conclusions and provisions, has no pronounced drawbacks and, therefore, can be recommended for publication.
Link to this article
You can simply select and copy link from below text field.
|
|