|
MAIN PAGE
> Back to contents
Arctic and Antarctica
Reference:
Kazantsev V.S., Krivenok L.A., Cherbunina M.Y., Kotov P.I.
Greenhouse gas emissions from natural ecosystems of the Norilsk Industrial District
// Arctic and Antarctica.
2023. № 4.
P. 19-41.
DOI: 10.7256/2453-8922.2023.4.69058 EDN: IHJPRJ URL: https://en.nbpublish.com/library_read_article.php?id=69058
Greenhouse gas emissions from natural ecosystems of the Norilsk Industrial District
Kazantsev Vladimir Sergeevich
ORCID: 0000-0002-0156-0566
PhD in Biology
Kazantsev Vladimir Sergeevich
119017, Russia, Moscow region, Moscow, lane. Pyzhevsky, 3

|
kazantsev@ifaran.ru
|
|
 |
Krivenok Lyudmila Alekseevna
ORCID: 0000-0001-8220-6720
Junior researcher at the Institute of Atmospheric Physics named after. A.M. Obukhov RAS
119017, Russia, Moscow, lane. Pyzhevsky, 3
|
|
krivenok@ifaran.ru
|
|
 |
Cherbunina Mariya Yur'evna
ORCID: 0000-0002-6211-7971
PhD in Geology and Mineralogy
Junior Researcher, Moscow State University M.V. Lomonosov
119991, Russia, Moscow region, Moscow, Leninskie Gory str., 1
|
|
cherbuninamariya@gmail.com
|
|
 |
|
Kotov Pavel Igorevich
ORCID: 0000-0002-5945-3405
PhD in Geology and Mineralogy
Director, Research Center ZSU named after. N.M. Fedorovsky
663310, Russia, Krasnoyarsk Territory, Norilsk, ul. 50let Oktyabrya, 7
|
|
KotovPI@norvuz.ru
|
|
 |
|
DOI: 10.7256/2453-8922.2023.4.69058
EDN: IHJPRJ
Received:
21-11-2023
Published:
21-12-2023
Abstract:
This paper describes the results of field measurements of methane and carbon dioxide fluxes from natural and anthropogenic-modified ecosystems located on the Norilsk industrial district. Previously, such studies have not been conducted in the area. The study points are located in different landscape regions determined by various conditions of permafrost formation. Most of the study area is located within the zone of predominantly continuous permafrost distribution. Six landscape regions were identified. Methane and carbon dioxide fluxes were measured at selected key sites typical for each region. When selecting the study points, the variety of conditions affecting methane and carbon dioxide emissions was considered. First, these include soil type (mineral or peat) and local moisture conditions. Methane and carbon dioxide fluxes were measured by dart static chamber method. Measurements of greenhouse gas concentrations in the chamber were carried out by a portable gas analyzer Li-7810 (Li-COR, USA). The results obtained show significant variability in greenhouse gas emissions for different ecosystem types. Methane uptake by soils is recorded on mineral soils and dry parts of bog ecosystems. Positive methane emissions are typical for watered areas of bog ecosystems and lakes with maximum values in the hollows. Methane fluxes range from slightly negative in dry bog areas with a median of -0.026 mgCH4/m2/h to emissions of 0.802 mgCH4/m2/h as the median for watered areas of bog ecosystems. Carbon dioxide fluxes are inversely correlated with the ecosystem moisture content and have a range from 51.6 mgCO2/m2/h (median for lakes) to 576 mgCO2/m2/h (median for mineral soils). A medium strength correlation was found between surface air temperature and intensity of methane uptake by mineral soils was found. Probability density distributions of methane and carbon dioxide fluxes have different forms.
Keywords:
methane, carbon dioxide, bogs, lakes, freshwater ecosystems, specific fluxes, chamber method, carbon balance, landscapes, permafrost
This article is automatically translated.
You can find original text of the article here.
1. Introduction Current climate changes, including those caused by an increase in the content of greenhouse gases (GHGs) in the atmosphere, have been clearly recorded by scientists since the middle of the XIX century. The main GHGs include water vapor, methane and carbon dioxide. Sources of methane and carbon dioxide in the atmosphere are both anthropogenic and natural, among the latter lakes, rivers, and swamps play an important role [1]. One of the urgent tasks of modern ecology is the inventory of GHG sources on a global scale. This is necessary both for an adequate assessment of GHG emissions from natural and anthropogenic sources, and for the construction and verification of forecast emission models under climate change conditions. In connection with the above, GHG sources that are located in the Arctic zone are of particular interest, since it is for this territory that the most intense climate change is predicted, including manifested in the form of an increase in the average annual air temperature. It is expected that this process will affect an increase in the intensity of GHG emissions from the natural ecosystems of the Arctic due to the involvement in the biological cycle of part of the reserves of organic matter, which is currently located in the permafrost. In general, the Russian Arctic has so far been poorly studied in terms of the inventory of GHG sources into the atmosphere. The available studies relate to a relatively small number of objects located on the territory of the Arctic part of Eurasia. Due to logistical difficulties, the main points of research on GHG emissions are located near settlements or transport communications and do not cover a wide variety of natural ecosystems in the Arctic. We do not know any results of the study of GHG emissions from the natural ecosystems of the Norilsk Industrial District (NPR). From nearby regions with similar natural conditions, the northern part of Western Siberia has been studied to a greater extent with regard to GHG emissions. In the southern tundra subzone, the first studies of methane emissions were conducted in 1996 during the spring snowmelt and in the summer in the south of the Yamal Peninsula [2]. The works [3-5] describe the results of studying the natural freshwater ecosystems of the southern and northern tundra in the area of the village of Tazovsky in the Yamalo-Nenets Autonomous Okrug. As part of the study [6], field measurements of methane emissions were carried out in a forest-tundra zone 10 km north of Igarka. The connection of atmospheric methane consumption by mineral soils with the distribution of permafrost rocks and soil moisture regime was shown, and high emissions from thermokarst lake were noted. One of the latest works [7] provides the results of studying methane emissions from lakes in the Circumpolar Urals and Central Yamal. The paper also revealed the influence of wind speed on CH4 emissions, and the daily dynamics of methane emissions is described using the example of one lake. One of the main factors influencing the process of carbon dioxide methane emission is soil humidity and temperature [8]. With an increase in the humidity of swamp and mineral soils, the process of methane emission intensifies and carbon dioxide emissions decrease due to a shift in the equilibrium of the processes of methane and carbon dioxide release and methane uptake by bacteria [9]. The temperature of the soil substrate also affects the process of methane emission towards its intensification due to an increase in the activity of methane-producing bacteria [10]. The purpose of this study was to study the characteristics of methane and carbon dioxide emissions from natural ecosystems in the territory of the NPR. In this regard, the task was set to carry out full-scale measurements of methane and carbon dioxide emissions from the surface of natural objects, to assess the influence of natural factors, to determine the natural factors affecting the emission of these GHGs. 2. The methodology 2.1 Landscape zoning To select the location of the study points, a preliminary zoning of the territory was carried out according to the natural conditions determining the formation of permafrost rocks (MMP) of the area in order to identify the most typical landscapes. The studied area is located in a zone of predominantly continuous distribution of MMP. The distribution of MMP by area is determined by the combined influence of zonal, regional and local factors of heat exchange of rocks with the atmosphere, and due to the wide variety of the latter, it turns out to be very difficult. When choosing the points for measuring GHG, the area of distribution of the area in which the most typical landscapes, geological structure and its geocryological features were highlighted was taken into account. Below is a description of each designated area. Area 1 represents the landscapes of the Kharaelakh River valley and the foothills of the Putorano plateau. It is dominated by gentle slopes of the Upper Pleistocene-Holocene age, where deluvial-solifluction deposits of gravel and crushed stone with loamy aggregate, often detached, are developed in conditions of increased moisture. A feature of this territory is also the presence of nested marginal moraines in the valley-side parts of the slopes due to the mountain-valley Upper Pleistocene glaciation. From a geocryological point of view, this area is characterized by a continuous distribution of MMP with a thickness of 200-400 m and the lowest rock temperatures from -2 to -5 °C [11-12]. District 2 occupies a vast territory and is located on the widespread surface of the Lacustrine-glacial Upper Pleistocene lowland, which belongs to the geomorphological level of the Valkovskaya plain, composed of a thickness of siltstones, ribbon clays, silts. Its formation is associated with the drainage of the Valkovsky glacial freshwater reservoir, which disappeared during the Holocene optimum. In the literature, this surface is more often designated as the Valkovsky lake-alluvial plain or terrace, whereas on the map of quaternary deposits [13] it is designated as lake-glacial [13-14]. The area is characterized by a bumpy-occidental relief, extremely dissected, associated with the active development of thermokarst in strongly hilly deposits and the presence of a large number of segregation-injection heave mounds [15]. There is an intermittent distribution of MMP with a capacity of 40-80 m, with mild temperature conditions – average annual rock temperatures from 0 to -2 ° C.
District 3 is located near the Norilsk River at the confluence of the Valek River, which is its right tributary (belongs to the Rybninsk-Norilsk Valley). The location of the area here allows us to characterize the landscape and geocryological conditions of the territories affected by the river. Here, the surfaces of the floodplain bed and terraces of the Norilsk River, the old man of the Valek river, probably of Holocene age, are distinguished, composed of a layered layer of sandy siltstone composition with inclusions of plant detritus. The slopes of the terrace are covered with larch-spruce-birch forest with shrubs, floodplain vegetation in the form of mixed grasses with willow bushes. It is characterized by intermittent propagation of MMP with a capacity of 40-80 m with average annual rock temperatures from 0 to -2?. Separate permafrost islands with temperatures from 1 to -1 °C are noted for ancient sediments and near-sediments in the valley of the Norilsk River. District 4 is located in the Oganera district in a technogenically transformed landscape (also refers to the Rybninsk-Norilsk Valley). Here, in comparison with area 3, the original forests are being replaced by shrubby tundra due to aerotechnogenic effects from the mining and metallurgical combine [16]. In the area, landfills of re-vein ice extraction (PLL) and the associated waterlogging process are widespread. One of the largest areas in terms of area in the studied region. District 5 is located near the village. Alykel is located on a lake-glacial lowland, the sediments are composed of a thickness of siltstones, ribbon clays, silts. The surface is heavily swampy and overgrown (there are a large number of lakes, mostly of a rounded shape). The complex outlines of the lakes, the nature of their coastline (the presence of low stretches with overgrown parts of the lakes and steep precipitous shores) indicate their thermokarst origin. For MMP, a fairly wide temperature range is allocated from -1 to -5 ° C at a power of 60-120 m. Area 6 belongs to the Yenisei Late Pleistocene glacial accumulative surface composed of loamy moraine deposits. It is blackened and includes permafrost landforms, from which it is possible to distinguish the systems of the PLL and erosion-thermokarst basins. It belongs to the southern tundra, with characteristic shrub communities of various types of willows, which are formed in conditions of abundant moisture (in river valleys and along relief depressions on the watershed), sedge-fluff hummocks are less common. MMP capacities of about 60-120 m are typical here. A narrow range of low negative temperatures from -1 to -2 °C MMP is characterized by surfaces under flat, often swampy, hummocky shrub and shrub-moss tundras. This stability of temperature conditions is explained by the almost flat relief of the surface and the predominant moss ground cover. 2.2. Objects of research Studies of specific fluxes of methane and carbon dioxide were conducted on the territory of the Norilsk Industrial District on July 3-8, 2023. The location of the points at which the UP was measured is shown in Figure 1, the coordinates and description of the points are in Table 1. Swamp ecosystems were classified according to [17]. 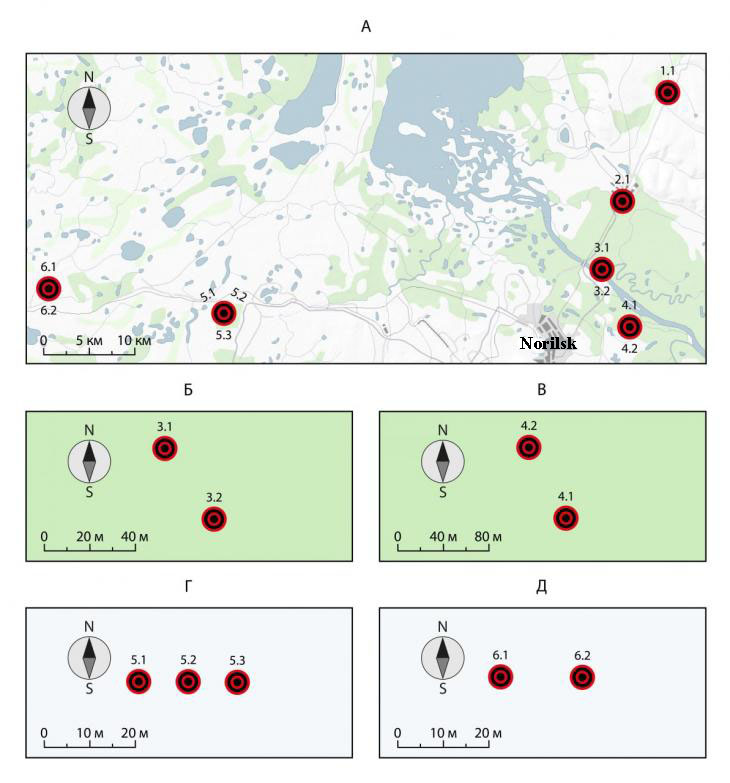
Figure 1. The layout of the points of the CH 4 and CO 2 emission study. Table 1. Characteristics of GHG emission measurement points Landshaf-tny district / Point of measurement of UP | | | | | | Humidification conditions | | | | | weight capacity, d.e/power,m | | | | | Mineral soil under a shrub community on a mountain slope | | | | gentle slopes of the foothills of the Upper Pleistocene-Holocene age | Waterlogged (temporary watercourses) | | | | | Mineral soil under the forest community | | | | lake-glacial (lake-alluvial) hummocky-zapadinnaya lowland (Valkovskaya terrace) | | | | | | Mineral soil under the forest community on the slope of the I above-floodplain terrace | | | the slope of the first above-floodplain terrace of the Norilsk river | | | | | | A watered, blocked river elder | | | | | | | | A lake in a large-bumpy marshland-lake complex | | | lake-glacial (lake-alluvial) hummocky-zapadinnaya lowland (Valkovskaya terrace) | | | | | | A hillock in a large-bumpy marshland-lake complex | | | | | | | | A hillock in a polygonal bumpy-lake complex | | | | lacustrine-glacial lowland, the surface is heavily swampy and overgrown | Different moisture content of the surface on the mounds, waterlogged in depressions | | | | | A lake in a polygonal bumpy lake complex. | | | | | | A drainage basin in a polygonal bumpy-lake complex | | | | | | | A hillock in a flat-hummocky-marshy complex | | | | The Yenisei glacial accumulative lowland with a characteristic hilly-moraine relief | Drained surface on mounds, waterlogged in depressions | | | | | A marshy drainage basin in a flat-hummocky-marshy complex | | | All points were also grouped according to the type of ecosystem (focusing on the degree of moisture) as follows. I. Located on mineral well–drained soils (points 1.1, 2.1 and 3.1, Fig. 2 A-B). Point 1.1 is located in the foothills of the Putorana plateau near the Rocky mine on a slightly inclined relatively flat surface complicated by the activity of temporary watercourses, as well as the presence of large-scale debris from landslides and scree. The microrelief of the surface is finely rounded. The size of the mounds is on average 1.5 x 1.5 m, up to 0.2 m in height. Point 2.1 is located on a slightly inclined slightly moistened surface (angle of inclination 3-5°) on mineral soil. Point 3.1 is located on the slope of the I above-floodplain terrace of the Valek river on a slightly inclined surface (angle of inclination 3-5 °). The surface is finely bumpy, the size of the mounds is from 0.1 x 0.1 to 0.8 x 0.9 m. 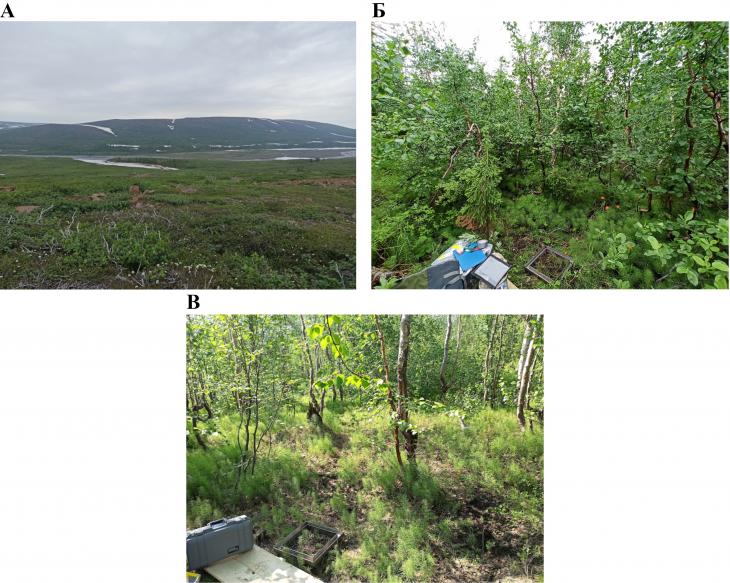
Figure 2. Points A – 1.1, B – 2.1, C – 3.1 II. Dry areas of swamp ecosystems (points 4.2, 5.1 and 6.1, Fig. 3 A–B). Point 4.2 is located on a poorly drained swampy area of the Valkovskaya plain. The surface of the site is bumpy-occidental, the size of the mounds varies from 4 x 4 to 10 x 15 m. Measurements of GHG were carried out on a hillock in a large-bumpy topian-lake complex. Point 5.1 is located in the Valkovskaya plain in a blocked lowland. The surface relief is finely bumpy, represented by dry bumps and wet hollows. The size of the mounds varies from 1.3 x 1.3 m to 3 x 7 m, with micro-holes up to 3-5 m in size between them. The entire research site 5 is located in a polygonal bumpy-lake swamp, measurements at point 5.1 cover the hillock. Point 6.1 is located on the Valkovskaya plain in a drained lake basin. The surface relief is finely bumpy, represented by dry bumps and wet hollows. The size of the mounds varies from 0.3 x 0.3 m to 1 x 0.4 m. The processes of waterlogging and thermokarst are developing. A static camera is installed on a hillock in a flat-hummocky-marshy complex. 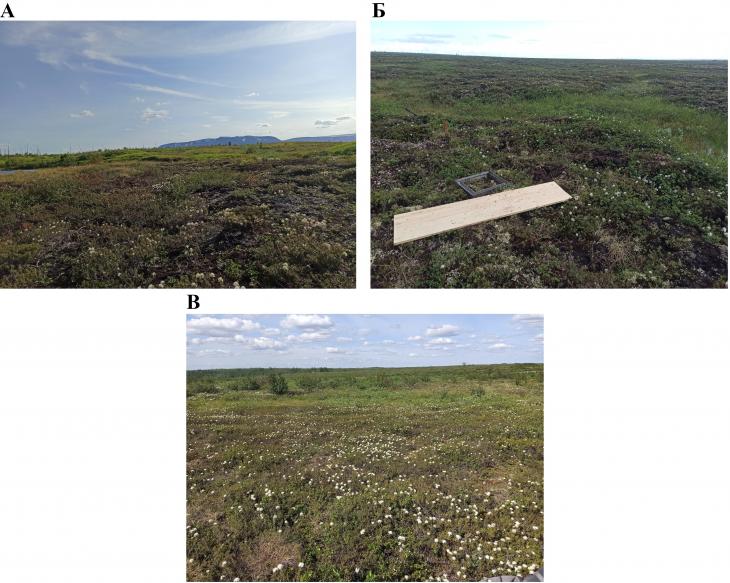
Figure 3. Points A – 4.2, B – 5.1, C – 6.1 III. Watered areas of swamp ecosystems (points 3.2, 5.3 and 6.2, Fig. 4 A–B). Point 3.2 is located in the staritsa of the Valek river on a flat, flat, swampy, waterlogged surface about 40 m from point 3.1. The level of swamp waters (UBW) on the site is on average 20-30 cm above the surface. The camera was installed on a swampy, watered river elder, with a depth of 8 cm above the surface in the camera. Point 5.3 is located at a distance of about 15 m from point 5.1 in the drain, 0 cm away. Point 6.2 is located about 50 m from point 6.1, also in a drained lake basin (see the corresponding description). The static camera is installed in a furnace well of a flat-edged-swamp complex with a depth of 0 cm. 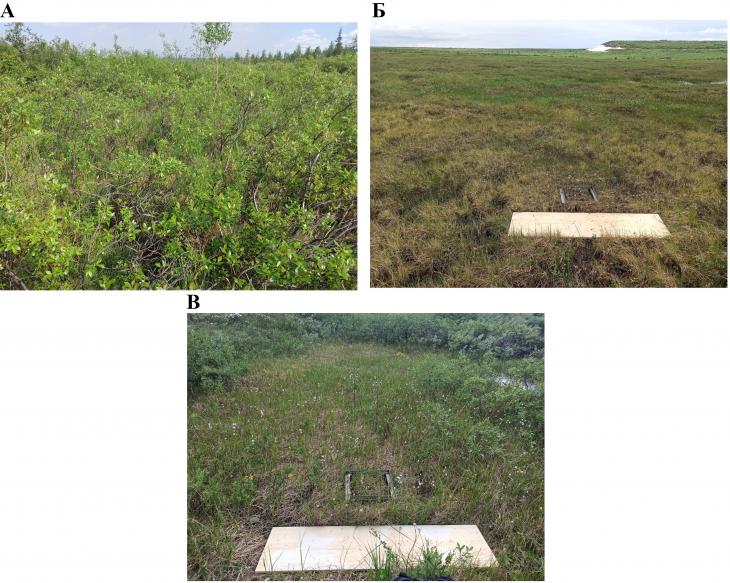
Figure 4. Points A – 3.2, B – 5.3, C – 6.2 IV. Aquatic ecosystems (Lake 4.1 and lake 5.2, Fig. 5 A–B). Point 4.1 is located about 100 m from point 4.2. Measurements were carried out from the surface of the lake at a point with a depth of 2 m, bubbles were observed rising on the surface (they did not get into the chamber, because during the measurement process, sharp jumps in concentrations were not noticed). Point 5.2 is located at a distance of about 15 m from point 5.1 and is a lake with a diameter of about 5 m and a depth of 10 cm. There were rare sedge stalks directly in the chamber. 
Figure 5. Points A – 4.1, B – 5.2 2.3. Methods of field measurements and data processing Measurements of specific GHG fluxes were carried out by the method of manual static dark chambers with a water lock [18-19], dark floating chambers were used to study aquatic ecosystems [20] (Fig. 6 A–B). The method is relatively simple in execution and is widely used for measuring GHG emissions from the surface of natural and anthropogenic ecosystems. The size of the ground chamber was 40x40x30 cm, the base area was 36x36 cm. The volumes of the two floating chambers used were 8.2 l and 7.8 l, the areas were 0.0082 m2 and 0.0095 m2, respectively. In the ground chambers, a fan was mounted inside to homogenize the air, a fan was not installed inside the water chamber due to its small volume (since air was continuously pumped through the gas analyzer). The concentrations of methane and carbon dioxide in the chamber were determined by a portable LI-COR LI-7810 gas analyzer (LI-COR, USA). The gas analyzer was hermetically connected to the chamber with two inlet and outlet tubes. Concentrations of methane and carbon dioxide were determined at a frequency of 1 time per second. The exposure time was 4-5 minutes, from 8 to 12 measurements were taken at each point. In parallel to each measurement, measurements were made of the properties of the surface layer of the atmosphere: air temperature, atmospheric pressure, wind speed. These parameters were determined by the Kestrel 5500 manual weather station (Nielsen-Kellerman, USA). A total of 106 measurements of methane and carbon dioxide emissions were carried out at 11 observation points. 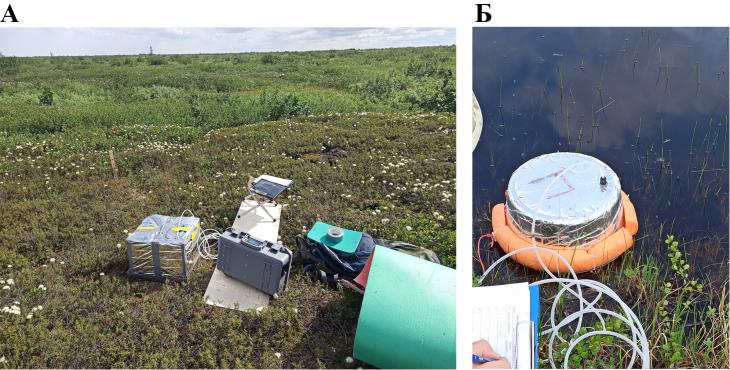
Figure 6. A is a static camera, B is a floating camera. The values of specific fluxes of methane and carbon dioxide were calculated by approximating the measured values (in time-concentration coordinates) by linear regression [21]. Statistical data processing was carried out in the software environment R 4.3.1. The restoration of probability densities was carried out using the nonparametric nuclear method using the density function with the determination of the optimal window width by the Sheather method & Jones (1991). 3. Measurement results Table 2 shows the results of measurements of methane and carbon dioxide emissions and meteorological parameters. The statistical characteristics of the obtained concentrations of methane and carbon dioxide are shown in Fig. 7 A–B. Table 2. Measurement results of methane and carbon dioxide emissions | Point | UP of methane, mgSN 4/m2/h | Consumption of carbon dioxide, MgSO 2/m2/h |
Wind speed, m/s | Pressure, gPa | Air temperature, °C | | 1.1 | -0,029 | 352,2 | 4,3 | 981,4 | 19,3 | | 1.1 | -0,026 | 326,9 | 4,8 | 981,3 | 19,5 | | 1.1 | -0,031 | 374,8 | 3,3 | 981,3 |
19,7 | | 1.1 | -0,032 | 377,1 | 3,1 | 981,2 | 19,7 | | 1.1 | -0,028 | 300,0 | 3,5 | 981,1 | 19,5 | | 1.1 | -0,022 | 302,0 | 3,5 | 980,7 | 20,0 | | 1.1 |
-0,019 | 280,8 | 5,0 | 980,6 | 19,6 | | 1.1 | -0,027 | 299,2 | 4,2 | 980,6 | 19,7 | | 1.1 | -0,026 | 305,7 | 4,5 | 980,6 | 19,4 | | 1.1 | -0,027 | 290,7 |
4,0 | 980,6 | 19,6 | | 2.1 | -0,034 | 966,8 | 0,0 | 998,7 | 24,6 | | 2.1 | -0,027 | 998,2 | 0,0 | 998,6 | 24,2 | | 2.1 | -0,024 | 996,8 | 0,2 | 998,7 |
24,0 | | 2.1 | -0,021 | 940,9 | 0,0 | 998,6 | 23,9 | | 2.1 | -0,021 | 927,4 | 0,0 | 998,4 | 24,6 | | 2.1 | -0,021 | 945,1 | 0,0 | 998,4 | 24,4 | |
2.1 | -0,021 | 906,1 | 0,0 | 998,4 | 24,1 | | 2.1 | -0,020 | 915,7 | 0,0 | 998,4 | 23,7 | | 2.1 | -0,020 | 897,2 | 0,0 | 998,4 | 24,0 | | 2.1 | -0,020 |
877,1 | 0,0 | 998,5 | 25,0 | | 3.1 | -0,016 | 693,5 | 0,0 | 1006,7 | 25,6 | | 3.1 | -0,010 | 691,5 | 0,0 | 1006,8 | 25,6 | | 3.1 | -0,003 | 569,7 | 0,0 |
1006,8 | 26,0 | | 3.1 | -0,005 | 582,5 | 0,0 | 1006,8 | 26,2 | | 3.1 | -0,004 | 590,5 | 0,0 | 1006,8 | 26,0 | | 3.1 | -0,001 | 545,9 | 0,0 | 1006,8 | 26,0 |
| 3.1 | -0,003 | 555,8 | 0,5 | 1006,9 | 26,3 | | 3.1 | -0,007 | 573,3 | 0,0 | 1006,8 | 26,1 | | 3.1 | -0,012 | 544,8 | 0,0 | 1006,8 | 26,3 | | 3.1 | -0,001 |
564,2 | 0,0 | 1006,8 | 26,8 | | 3.1 | -0,004 | 552,4 | 0,0 | 1006,7 | 26,5 | | 3.1 | -0,003 | 554,8 | 0,5 | 1006,7 | 24,6 | | 3.2 | 0,874 | 349,4 | 0,0 |
1006,5 | 28,2 | | 3.2 | 0,975 | 395,3 | 0,5 | 1006,6 | 27,5 | | 3.2 | 1,015 | 409,9 | 0,0 | 1006,6 | 28,8 | | 3.2 | 0,769 | 309,3 | 0,8 | 1006,5 | 28,5 |
| 3.2 | 0,775 | 330,6 | 0,5 | 1006,5 | 28,0 | | 3.2 | 0,704 | 282,6 | 1,4 | 1006,5 | 29,2 | | 3.2 | 0,697 | 285,8 | 1,0 | 1006,5 | 28,2 | | 3.2 |
0,828 | 332,8 | 0,0 | 1006,5 | 28,2 | | 3.2 | 0,745 | 310,1 | 0,5 | 1006,5 | 28,4 | | 3.2 | 0,726 | 301,6 | 0,3 | 1006,5 | 27,2 | | 4.1 | 0,236 | 36,4 |
0,7 | 1009,2 | 25,5 | | 4.1 | 0,334 | 46,9 | 0,8 | 1009,2 | 24,8 | | 4.1 | 0,381 | 50,2 | 0,6 | 1009,2 | 26,2 | | 4.1 | 0,183 | 24,9 | 0,3 | 1009,3 |
23,5 | | 4.1 | 0,352 | 46,0 | 0,4 | 1009,3 | 27,4 | | 4.1 | 0,283 | 38,5 | 0,6 | 1009,3 | 24,1 | | 4.1 | 0,553 | 69,2 | 0,7 | 1009,2 | 24,5 | | 4.1 |
0,193 | 26,7 | 0,4 | 1009,2 | 25,4 | | 4.1 | 0,377 | 42,2 | 1,0 | 1009,2 | 25,2 | | 4.1 | 0,429 | 57,1 | 1,0 | 1009,2 | 23,9 | | 4.2 | -0,033 | 431,5 |
2,5 | 1004,9 | 24,9 | | 4.2 | -0,023 | 407,8 | 2,5 | 1004,9 | 24,5 | | 4.2 | -0,018 | 381,7 | 1,9 | 1004,9 | 24,9 | | 4.2 | -0,014 | 357,7 | 2,3 | 1004,9 |
24,8 | | 4.2 | -0,013 | 381,4 | 2,5 | 1005,0 | 25,3 | | 4.2 | -0,013 | 366,3 | 2,7 | 1005,0 | 24,8 | | 4.2 | -0,014 | 358,5 | 1,1 | 1004,9 | 24,6 | |
4.2 | -0,013 | 352,2 | 1,1 | 1005,0 | 24,4 | | 4.2 | -0,014 | 345,8 | 2,1 | 1004,9 | 24,2 | | 4.2 | -0,014 | 348,5 | 1,3 | 1004,9 | 23,8 | | 5.1 | -0,044 |
501,0 | 1,6 | 999,7 | 17,2 | | 5.1 | -0,033 | 447,7 | 1,3 | 997,5 | 16,7 | | 5.1 | -0,032 | 414,3 | 1,3 | 997,5 | 18,4 | | 5.1 | -0,030 | 395,5 | 1,9 |
998,6 | 18,2 | | 5.1 | -0,030 | 409,3 | 1,8 | 999,4 | 18,2 | | 5.1 | -0,031 | 424,1 | 1,5 | 999,2 | 18,3 | | 5.1 | -0,030 | 417,2 | 2,5 | 999,0 | 20,1 |
| 5.1 | -0,026 | 417,4 | 3,3 | 999,1 | 19,0 | | 5.1 | -0,031 | 420,9 | 1,1 | 999,1 | 17,7 | | 5.1 | -0,030 | 392,8 | 2,9 | 999,2 | 17,2 | | 5.2 | 0,344 |
64,3 | 0,4 | 999,2 | 19,3 | | 5.2 | 0,300 | 76,2 | 0,8 | 999,2 | 19,2 | | 5.2 | 0,250 | 61,0 | 2,6 | 999,2 | 17,9 | | 5.2 | 0,157 | 46,0 | 1,9 |
999,1 | 19,9 | | 5.2 | 0,419 | 67,3 | 2,6 | 999,1 | 18,6 | | 5.2 | 0,256 | 62,3 | 1,3 | 999,1 | 19,2 | | 5.2 | 0,215 | 54,2 | 1,5 | 999,1 | 19,4 |
| 5.2 | 0,252 | 53,0 | 2,8 | 999,1 | 19,7 | | 5.3 | 0,138 | 261,5 | 3,6 | 999,1 | 19,0 | | 5.3 | 0,135 | 312,1 | 2,3 | 999,1 | 18,6 | | 5.3 |
0,132 | 329,4 | 2,0 | 999,0 | 18,7 | | 5.3 | 0,129 | 305,3 | 0,6 | 998,9 | 18,9 | | 5.3 | 0,128 | 284,8 | 2,6 | 998,9 | 18,3 | | 5.3 | 0,126 | 270,4 |
2,6 | 999,1 | 18,2 | | 5.3 | 0,126 | 282,7 | 2,4 | 999,1 | 18,0 | | 5.3 | 0,126 | 296,4 | 1,3 | 999,0 | 18,2 | | 6.1 | -0,044 | 597,7 | 1,1 | 1004,8 |
27,2 | | 6.1 | -0,028 | 548,1 | 1,8 | 1004,8 | 24,0 | | 6.1 | -0,026 | 527,8 | 1,1 | 1004,7 | 26,5 | | 6.1 | -0,022 | 497,0 | 1,0 | 1004,7 | 25,0 | | 6.1 |
-0,022 | 495,5 | 0,0 | 1004,7 | 25,4 | | 6.1 | -0,027 | 524,4 | 1,6 | 1004,6 | 24,7 | | 6.1 | -0,023 | 500,9 | 1,7 | 1004,7 | 23,3 | | 6.1 | -0,020 | 435,3
| 1,7 | 1004,7 | 26,7 | | 6.2 | 5,086 | 675,0 | 1,2 | 1004,8 | 24,2 | | 6.2 | 5,084 | 710,5 | 0,7 | 1004,9 | 23,9 | | 6.2 | 5,454 | 737,3 | 0,8 | 1004,9
| 25,0 | | 6.2 | 5,304 | 735,6 | 0,6 | 1004,8 | 23,9 | | 6.2 | 5,930 | 766,1 | 1,2 | 1004,8 | 24,0 | | 6.2 | 6,500 | 799,0 | 0,0 | 1004,8 | 25,5 | |
6.2 | 6,509 | 838,3 | 0,0 | 1004,8 | 28,9 | | 6.2 | 6,027 | 789,8 | 1,1 | 1004,7 | 27,3 | | 6.2 | 5,772 | 866,7 | 0,7 | 1004,7 | 26,2 | | 6.2 | 5,458 |
830,5 | 1,2 | 1004,7 | 25,4 | 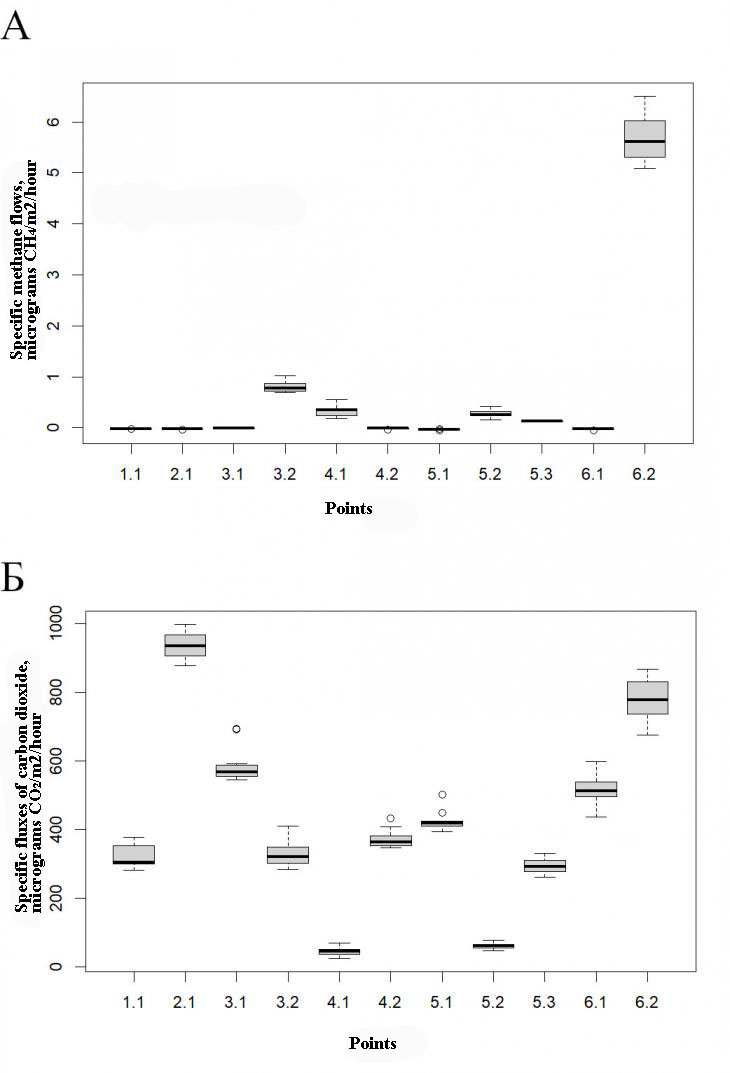
Figure 7. Statistical characteristics of specific fluxes of methane (A) and carbon dioxide (B) measured as a result of field work in 2023 (the diagram shows: the line inside the box is the median, the borders of the box are the lower and upper quartile, the whiskers are the minimum and maximum, the round marker is the outliers) An average correlation (R 2=0.57) of methane content from the surface of mineral soils with air temperature was found (Fig. 8). We assume that this may be due to a change in the ratio of activity of methanogens and methanotorphs in the soil towards a decrease in the role of the process of aerobic methanotrophy. 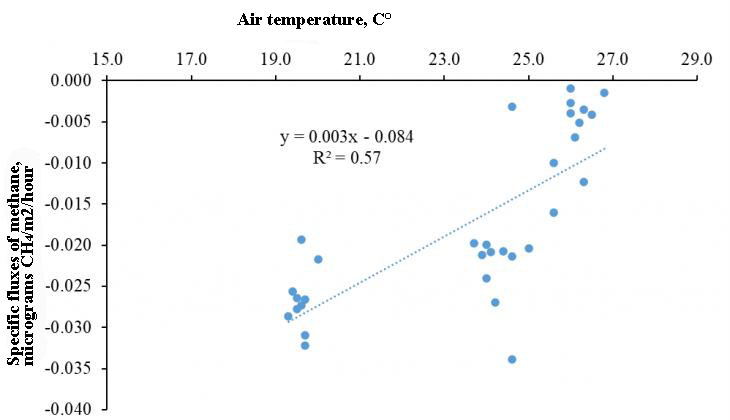
Figure 8. Dependence of specific methane fluxes from mineral soils on air temperature. The results obtained indicate a significant influence of humidification conditions on the intensity of methane emission (Fig. 9A). Dry mineral soils, as well as well-aerated elevated parts of swamp complexes, are characterized by weakly negative values of methane UP, which means the process of absorption of atmospheric methane by these ecosystems. Methane emissions into the atmosphere are observed from the surface of aquatic and humidified swamp ecosystems. The maximum recorded value of methane emission is 6.5 mgSN 4/m2/h from the surface of the moistened well at point 6.2. Humidification conditions also have a noticeable effect on the process of carbon dioxide emission (Fig. 9B). The minimum values of CO2 emissions are typical for humidified areas with an intensification of the process of releasing carbon dioxide into the atmosphere from the surface of dry areas of ecosystems. Thus, the maximum measured UP of CO2 is 998.2 MGCO2/m2/h from the surface of the mineral soil at point 2.1. The minimum UP of 27.6 MGCO2/m2/h was recorded from the surface of an intracoastal lake at point 4.1. An exception to this pattern is a moistened swamp drainage at point 6.2. The median values of the measured UP of carbon dioxide for this observation point, it is 777.9 MGCO2/m2/h. 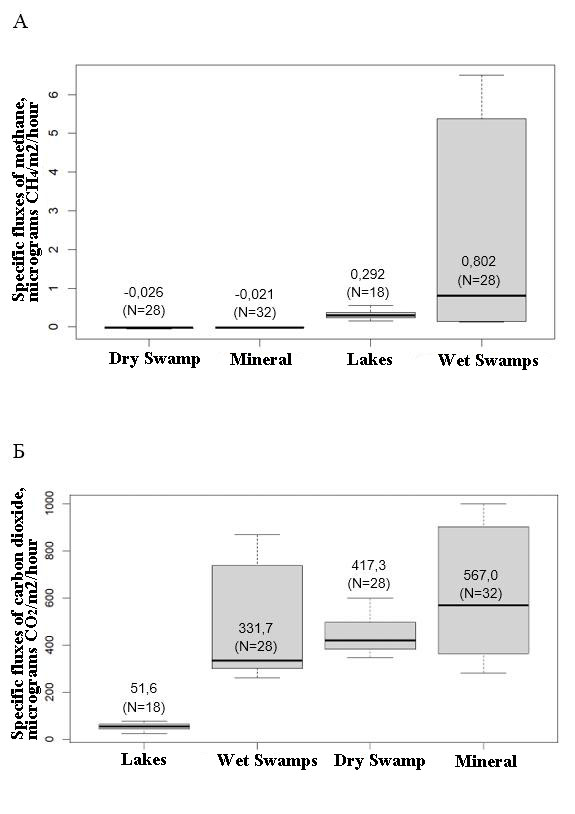
Figure 9. Statistical characteristics of specific fluxes of methane (A) and carbon dioxide (B) measured as a result of field work in 2023, grouped by the degree of moisture content of the ecosystem (the diagram shows: numerical value – median, N – sample size, line inside the box – median, box boundaries – lower and upper quartile, whiskers – minimum and maximum, round marker – outliers; groups on the graph are arranged by increasing the median) The maximum methane emission from the surface of swamp wells can be explained by a good warming of the surface layer of a moistened swamp and the presence of a large amount of nutrients for methanogens. The combination of these conditions contributes to the intensification of the methanogenesis process. Also, the produced CH4 undergoes a relatively small layer of methane oxidation before being released into the atmosphere. In this regard, a small emission of methane from the surface of the lake can be explained by weak warming of bottom sediments, where the process of methane generation takes place and partial oxidation of methane released from the bottom when passing through the water column of the lake from the bottom to the surface. The increase in the median values of carbon dioxide emissions is noticeable as the humidity of ecosystems decreases. This is due to the fact that microorganisms producing carbon dioxide are in such ecosystems in the most favorable conditions for themselves. Figures 10-11 A–D show the probability density distributions of the measured concentrations of methane and carbon dioxide. It is noticeable that all distributions are polymodal (have several maxima), with the exception of the observed distributions of GHG from aquatic ecosystems close to normal. 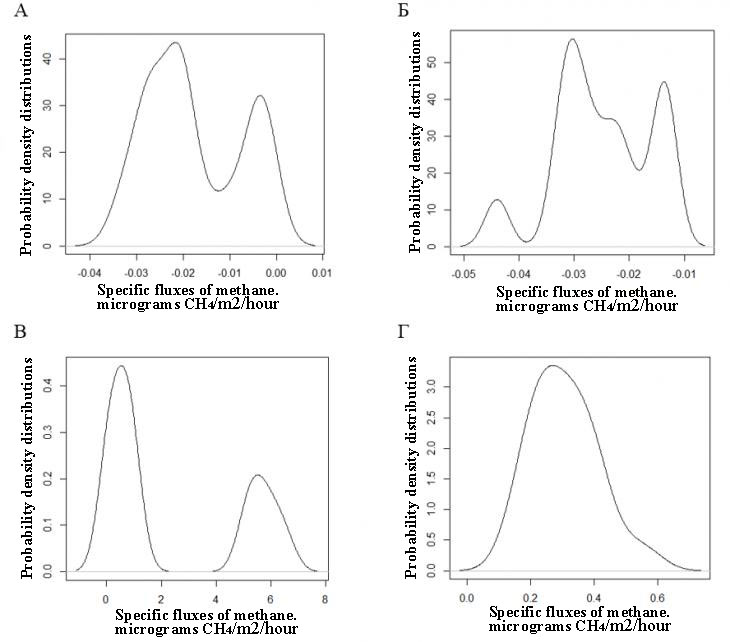
Figure 10. Distributions of the probability density of methane production for: A – sites on mineral soils, B – dry areas of swamp ecosystems, C – watered areas of swamp ecosystems, D – aquatic ecosystems. 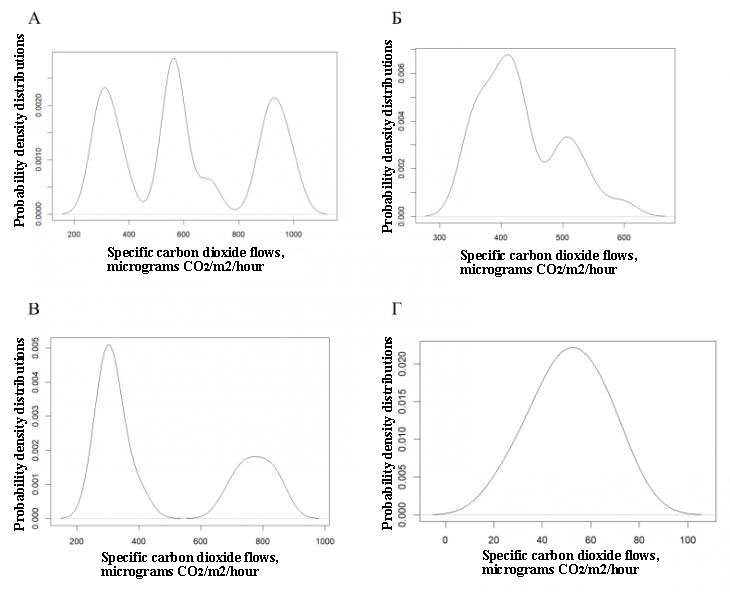
Figure 11. Distributions of probability densities of UP with 2 for: A – sites on mineral soils, B – dry sites of swamp ecosystems, C – watered sites of swamp ecosystems, D – aquatic ecosystems. The data obtained in this work are in good agreement with the results of studies conducted in similar natural conditions on similar elements of natural ecosystems. Methane emissions from lakes within the NPR are characterized by median values of 0.34 mgSN 4/m2/h for point 4.1 and 0.25 mgSN 4/m2/h for point 5.2. These results fall within the range between the medians of the measured values of methane UP from the surface of tundra lakes for two key sites in the southern tundra of Western Siberia "Yasaway" and "Tazovsky" [4], which are equal to 0.37 mgSN 4/m2/h and 1.14 mgSN 4/m2/h, respectively. But at the same time, the median values of the methane content of the studied lakes in the territory of the NPR are higher than similar emission indicators from the lakes of the Vaskina Dacha hospital in the typical tundra of Yamal. The 6 lakes studied there are characterized by median values of UPM in the range from 0.03–0.34 mgSN 4/m2/h. In the area of the Yasaway point, CO2 emissions from the surface of lakes were also measured in the summer of 2016 [5]. In this paper, the average emission value is 79.4 MGCO2/m2/h, which exceeds the average value of the CO 2 level measured at points 4.1 and 5.2, where the averages are 43.8 and 60.5 MGCO2/m2/h, respectively. The medians of the measured values of methane UP from moistened wetlands (points 3.2, 6.2, 5.3) are, respectively, 0.77 mgSN 4/m2/h; 5.62 mgSN 4/m2/h; 0.13 mgSN 4/m2/h. As can be seen, there is a large range of values between the points, which shows the need to study a large number of objects to obtain typical emission values from wetlands. A similar pattern was observed in the moistened areas of the southern tundra swamps at the Yasaway site [3]. There, at different points, the median values of methane consumption from humidified areas are 0,03/0,96/1,42/2,42 mgSN 4/m2/h. Thus, methane emissions at point 6.2 are higher than emissions at similar facilities within the studied region and the Yasaway site. At the same time, emissions at two other sites in the vicinity of Norilsk are consistent with the results obtained in Western Siberia. Methane uptake from dry areas of swamp ecosystems, as well as for mineral soils, is characterized by weak negative flows, that is, a low-intensity process of absorption of atmospheric methane. The medians of the measured values of methane concentration at points 4.2, 6.1 and 5.1 are -0.01, -0.02 and -0.03 mgSN 4/m2/h, respectively. This result is almost similar to the results from [3], where the median of the measured methane UP from the surface of frozen mounds is also near-zero and is 0.01 mgSN 4/m2/h, and less than the weakly positive median methane UP of 0.08 mgSN 4/m2/h from the surface of frozen mounds at the Yamburg point in the southern tundra Western Siberia [22]. Conclusions The study examined the emission of methane and carbon dioxide from the surface of natural ecosystems within the Norilsk industrial district within the boundaries of 6 designated landscape areas. The results obtained show significant variability in greenhouse gas emissions for different types of ecosystems. The absorption of methane by soils is recorded on mineral soils and dry areas of swamp landscapes. Positive values of methane emissions are typical for watered areas of swamp ecosystems and lakes with maximum values in wells. Carbon dioxide emissions have the opposite pattern: the values of specific fluxes of CO2 decrease as the moisture content of ecosystems increases. An average correlation was found between the temperature of the surface air layer and the intensity of methane absorption by mineral soils. For aquatic ecosystems, a single-modal distribution of probability densities of specific fluxes of methane and carbon dioxide is characteristic, while for other types of ecosystems, the constructed distributions are polymodal in nature.
References
1. Masson-Delmotte, V., Zhai, P., Pirani, A., Connors, S.L., Péan, C., Berger, S., Caud, N., Chen, Y., Goldfarb, L., Gomis, M.I., Huang, M., Leitzell, K., Lonnoy, E., Matthews, J.B.R., Maycock, T.K., Waterfield, T., Yelekçi, O., Yu, R., Zhou, B. (Eds.). (2023). Climate Change 2021: The Physical Science Basis. Working Group I Contribution to the IPCC Sixth Assessment Report. Cambridge University Press, Cambridge, United Kingdom and New York, NY, USA. doi:10.1017/9781009157896
2. Heyer, J., Berger, U., Kuzin, I.L., Yakovlev, O.N. (2002). Methane emissions from different ecosystem structures of the subarctic tundra in Western Siberia during midsummer and during the thawing period. Tellus B: Chemical and Physical Meteorology, 54(3), 231-249.
3. Sabrekov, A.F., Glagolev, M.V., Kleptsova, I.E., & Maksyutov, S.S. (2011). СН4 emission from West Siberia tundra mires. Environmental Dynamics and Global Climate Change, 2(1), 1-16.
4. Golubyatnikov, L.L., Kazantsev, V.S. (2013). Contribution of tundra lakes in western Siberia to the atmospheric methane budget. Izv. Atmos. Ocean. Phys., 49(4), 430-438.
5. Serikova, S., Pokrovsky, O.S., Laudon, H., Krickov, I.V., Lim, A.G., Manasypov, R.M., & Karlsson, J. (2019). High carbon emissions from thermokarst lakes of Western Siberia. Nature Communications, 10(1), 1552.
6. Flessa, H., Rodionov, A., Dyckmans, J., & Guggenberger, G. (2006). Landscape controls of CH4 fluxes and soil organic matter in a catchment of the forest tundra at the lower Yenissej. In Symptom of Environmental Change in Siberian Permafrost Region. Proceedings of the International Symposium of JSPS Core to Core Program between Hokkaido University and Martin Luther University Halle-Wittenberg (29-30 November 2005, Sapporo, Japan). Hatano, R., Guggenberger, G. (Eds.). Sapporo: Hokkaido University Press, 65-74.
7. Kazantsev, V.S., Krivenok, L.A., Dvornikov, Y.A., Lomov, V.A., Sabrekov, A.F. (2023). Methane Emission from Lakes in the North of Western Siberia. Izv. Atmos. Ocean. Phys, 59, 264–274. doi:10.1134/S0001433823030052
8. Le Mer, J., Roger, P. (2001). Production, oxidation, emission and consumption of methane by soils: a review. European journal of soil biology, 37(1), 25-50.
9. Moore, T.R., Dalva, M. (1993). The influence of temperature and water-table position on carbon-dioxide and methane emissions from laboratory columns of peatland soils. European Journal of Soil Science, 44(4), 651–664.
10. Van Bodegon, P.M., Stams, A.J.M. (1999). Effects of alternative electron acceptors and temperature on methanogenesis in rice paddy soils. Chemosphere, 39(2), 167–182.
11. Ershov, E.D. (Ed.). (1989). Geocryology of the USSR. Central Siberia. Мoscow: Nedra.
12. Kovpiy, А.N. (2000). Comprehensive hydrogeological and engineering-geological survey at a scale of 1:200 000 (Sheets R-45-79-82; 91-94; 103-106; 115-118) for 1993-1999). Report. Таlnakh: PGC «Norilskgeology».
13. The Map of Quaternary Formations. State geological map of the Russian Federation (third generation). Scale 1:1 000 000. Norilsk series. Sheet R-45. (2016). Saint Petersburg: Kartfactory VSEGEI.
14. Explanatory note. State geological map of the Russian Federation (third generation). Scale 1:1 000 000. Norilsk series. Sheet R-45. (2016). Saint Petersburg: Kartfactory VSEGEI.
15. Tolmanov, V.A., Grebenets, V.I., Isakov, V.A., & Kerimov, A.G. (2017). Deformations of the roadbed in difficult permafrost conditions of the Norilsk industrial area. In Prospects for development of engineering survey in Russian Federation: Materials of the 13th All-Russian сonference of prospecting organizations. Moscow: Geomarketing, 251–258.
16. Kravtsova, V.I., Zheleznyy, О. М. (2022). Vegetation dynamics of the Norilsk industrial region under the influence of aerotechnogenic and natural factors. In InterCarto. InterGIS. GI support of sustainable development of territories: Proceedings of the International conference. Мoscow: MSU, Faculty of Geography, 28(1), 325–345.
17. Usova, L.I. (2009). Practical guide on landscape interpretation of aerial photographs of different types of wetlands in Western Siberia. (78 p.). St. Petersburg: Nestor-Istoriya.
18. Hutchinson, G.L., Mosier, A.R. (1981). Improved soil cover method for field measurement of nitrous oxide fluxes. Soil Science Society of America Journal, 45(2), 311-316.
19. Glagolev, M.V., Sabrekov, A.F., Kazantsev, V.S. (2010). Physical chemistry and biology of peat. Methods for measure gas exchange at the soil-atmosphere interface. Tomsk: Tomsk State Pedagogical University.
20. Tremblay, A., Varfalvy, L., Roehm, C., Garneau, M. (Eds.). (2005). Greenhouse Gas Emissions: Fluxes and Processes, Hydroelectric Reservoirs and Natural Environments. Environmental Science Series. N.Y.: Springer.
21. Fiedler, J., Fuß, R., Glatzel, S., Hagemann, U., Huth, V., Jordan, S., Jurasinski, G., Kutzbach, L., Maier, M., Schaefer, K., Weber, T., Weymann, D. (2022). Best practice guidline: Measurement of carbon dioxide, methane and nitrous oxide fluxes between soil-vegetation-systems and the atmosphere using non-steady state chambers. (70 p.). Göttingen: Arbeitsgruppe Bodengase, Deutsche Bodenkundliche Gesellschaft. doi:10.23689/fidgeo-5422.
22. Sabrekov, A.F., Glagolev, M.V., Kleptsova, I.E., Bashkin, V.N., Barsukov, P.A., & Maksyutov, S.S. (2011). Contibution of palsa to methane emission from West Siberian tundra wetlands. Environmental Dynamics and Global Climate Change, 2(4), 2.
Peer Review
Peer reviewers' evaluations remain confidential and are not disclosed to the public. Only external reviews, authorized for publication by the article's author(s), are made public. Typically, these final reviews are conducted after the manuscript's revision. Adhering to our double-blind review policy, the reviewer's identity is kept confidential.
The list of publisher reviewers can be found here.
The subject of the study, according to the author, is the peculiarities of studying the formation and emission of greenhouse gases from the natural ecosystems of the Norilsk industrial district, and the sources of methane and carbon dioxide in the atmosphere are both anthropogenic and natural, among the latter lakes, rivers, and swamps play a significant role. Research methodology based on the analysis of the article, it can be concluded that the use of methods of preliminary zoning of the territory according to natural conditions determining the formation of permafrost rocks, remote monitoring of the earth's surface to identify typical landscapes. The author of the article investigated the specific fluxes of methane and carbon dioxide during field studies, the degree of soil moisture depending on geomorphology and permafrost, conducted statistical processing of data obtained from the approximation of measured values using the density function with the determination of the optimal window width by the Sheather method & Jones (1991). The author has undertaken expeditionary field research methods, experiments in the study of greenhouse gas fluxes with subsequent in-house treatment. The relevance of the topic of monitoring is unconditional and consists in obtaining information about the actual processes of climate change, caused, among other things, by the increase in the content of greenhouse gases in the atmosphere since the middle of the XIX century, which include water vapor, methane and carbon dioxide. One of the urgent tasks of modern ecology is the inventory of GHG sources on a global scale for an adequate assessment of greenhouse gas emissions from natural and anthropogenic sources, as well as for the construction and verification of forecast emission models under climate change conditions. The research of the author of the article helps to understand the mechanism of gas exchange on changes in weather and climatic conditions. The scientific novelty lies in the attempt of the author of the article, based on the conducted research, to draw a conclusion about the results of field, laboratory and theoretical investigations within the framework of the study of methane and carbon dioxide emissions from the surface of natural ecosystems within the Norilsk industrial district within the boundaries of six designated landscape areas. The results obtained show significant variability in greenhouse gas emissions for different types of ecosystems, which is an important addition to the development of geoecology. Style, structure, content the style of presentation of the results is quite scientific. The article is provided with rich illustrative material reflecting the process of formation of methane and carbon dioxide emissions from the surface of natural ecosystems. Tables, graphs, photographs are very illustrative, although the table could be somewhat shortened by systematizing the presented material or visualizing it in the form of diagrams. Under laboratory conditions, the processes of studying in different landscapes are considered, which makes the results presented by the author of the article very interesting. The bibliography is very comprehensive for the formulation of the issue under consideration, but does not contain references to normative legal acts. The appeal to the opponents is presented in identifying the problem at the level of available information obtained by the author as a result of the analysis. Conclusions, the interest of the readership in the conclusions there are generalizations that made it possible to apply the results obtained. The target group of information consumers is not specified in the article.
Link to this article
You can simply select and copy link from below text field.
|
|