|
MAIN PAGE
> Back to contents
Arctic and Antarctica
Reference:
Fedorov V.M., Zalikhanov A.M., Degtyarev K.S.
Peculiarities of Interannual Variability of Sea Ice Area in the Northern Hemisphere
// Arctic and Antarctica.
2023. № 2.
P. 102-114.
DOI: 10.7256/2453-8922.2023.2.41008 EDN: HGKGDS URL: https://en.nbpublish.com/library_read_article.php?id=41008
Peculiarities of Interannual Variability of Sea Ice Area in the Northern Hemisphere
Fedorov Valerii Mikhailovich
ORCID: 0000-0003-2305-7408
PhD in Geography
Leading Researcher, Geography Department, Lomonosov Moscow State University,
119991, Russia, Moscow region, Moscow, Leninskie Gory str., 1, office 1904B

|
fedorov.msu@mail.ru
|
|
 |
Zalikhanov Alim Mikhailovich
ORCID: 0000-0002-2540-6045
PhD in Geography
Senior Research Officer, Laboratory for Renewable Energy Sources, Lomonosov Moscow State University
119991, Russia, Moscow region, Moscow, Leninskie Gory str., 1, office 19
|
|
bulungu@yandex.ru
|
|
 |
|
Degtyarev Kirill Stanislavovich
ORCID: 0000-0002-1738-6320
PhD in Geography
Researcher, Lecturer, Laboratory for Renewable Energy Sources, Lomonosov Moscow State University,
119991, Russia, Moscow, Leninskie Gory str., 1, office 19
|
|
kir1111@rambler.ru
|
|
 |
|
DOI: 10.7256/2453-8922.2023.2.41008
EDN: HGKGDS
Received:
15-06-2023
Published:
27-06-2023
Abstract:
The research has been made on the basis of an array of ice data for the maximums and minimums seasonal distribution of sea ice in the Northern Hemisphere. The probability range for the appearance of positive differences after the negative ones in March is greater than in September, and conversely. During the periods of minimum (March) and maximum (September) interannual changes, after positive differences with an increase in the number of differences in the group, the values of subsequent changes increase. There is an increase in the probability of a one sign occurrence interannual difference with an increase in the group of another sign previous differences. For the probability of zero differences (absence of variability), there is an increase in both the probability of zero values and the number of previous zero differences. The results indicate the presence of a stabilization mechanism in the stochastic interannual variability of the sea ice area, which is confirmed by an increase in the probability of the appearance of a one sign and the number of previous differences of another sign in the group. An increase in the probability of zero values with an increase in the number of previous zero differences confirms the presence of geographical areas in which there are no interannual changes in the area of sea ice.
Keywords:
sea ice, Northern Hemisphere, area of sea ice, interannual variability, stochastic processes, Markov chains, ocean temperature, solar radiation, sea ice dynamics, meridional insolation gradient
This article is automatically translated.
You can find original text of the article here.
introduction The study of changes in sea ice and the causes of these changes is one of the urgent tasks of marine ice science [4; 9; 11]. The distribution and dynamics of sea ice depends on many factors determined by geophysical processes. These are, first of all, air temperature and humidity, ocean surface temperature, atmospheric circulation processes, sea currents, the presence and structure of halocline, cloud cover, river flow, albedo, etc. The basis of these factors is solar radiation coming to Earth – the main source of heat on Earth [5;10;16]. The most important parameter of the ice sheet is its area, which varies both in space and in time. Seasonal (annual course), long-term and interannual changes are distinguished. As our previous studies have shown, the annual course of the sea ice area is determined by the annual course of the Earth's insolation, but lags behind it in phase by 2 months [12; 13]. Spatial and temporal features of long-term changes in the area of sea ice are mainly determined by long-term changes in insolation contrast (IR). Long-term changes in the IR, generalized by the areas of the heat source and sink, reflect long-term changes in the meridional gradient of insolation [14]. The interannual variability is determined by the fluctuations of the natural system and its components. These fluctuations are stochastic, which is why they are particularly difficult to model and predict. However, spatial and temporal features are noted, indicating the presence of regularities in the interannual variability of the characteristics of the state of the natural environment [1]. For example, for the Arctic Ocean, a close relationship was found between the annual course of the average module of the interannual variability of the sea ice area and the annual course of irradiation of the Northern Hemisphere, shifted 2 months into the past [14]. The purpose of this work is to identify spatial and temporal features in the interannual variability of the sea ice area in the Northern hemisphere, based on the analysis of an array of ice data. OBJECT AND METHODOLOGY OF RESEARCH The study of the interannual variability of the sea ice area for individual trapezoids with a size of 1 x 1 in latitude and longitude on the scale of the entire Northern Hemisphere was carried out. The database of the Hadley Meteorological Center was used as an object of research [18]. The information presented in the HadISST1 database on the average monthly temperature of the ocean surface and the area of sea ice in the Northern and Southern hemispheres was obtained as a result of combining into a single array of reanalysis data (ERA40) performed using empirical orthogonal functions (EOF) and data from instrumental and visual (primarily ship and satellite) observations. The reconstruction of the sea ice area in the array using a 1°x1° grid was performed on the basis of algorithms for approximation and extrapolation of available data (digitized maps of the sea ice area, data from ship and satellite observations) taking into account the ocean surface temperature (TPO) [17]. The array presents data on the average monthly area of sea ice in a spatial cell of 1°x1° as a percentage of the cell area (ice cover), from 1870 to the present. We analyzed an array of 7,400 cells, each of which contains information on the area of sea ice with monthly values for the period from 1901 to 2020. x 1 in latitude and longitude on the scale of the entire Northern Hemisphere was carried out. The database of the Hadley Meteorological Center was used as an object of research [18]. The information presented in the HadISST1 database on the average monthly temperature of the ocean surface and the area of sea ice in the Northern and Southern hemispheres was obtained as a result of combining into a single array of reanalysis data (ERA40) performed using empirical orthogonal functions (EOF) and data from instrumental and visual (primarily ship and satellite) observations. The reconstruction of the sea ice area in the array using a 1°x1° grid was performed on the basis of algorithms for approximation and extrapolation of available data (digitized maps of the sea ice area, data from ship and satellite observations) taking into account the ocean surface temperature (TPO) [17]. The array presents data on the average monthly area of sea ice in a spatial cell of 1°x1° as a percentage of the cell area (ice cover), from 1870 to the present. We analyzed an array of 7,400 cells, each of which contains information on the area of sea ice with monthly values for the period from 1901 to 2020. To study the interannual variability of the sea ice area, a technique based on the Markov properties of natural variability was used, which was tested earlier in the study of the natural variability of the climate characteristics of the northern polar region and the Northern hemisphere [1]. This technique has been used by us (in this paper) in studies of the interannual variability of the area of sea ice in the Northern hemisphere. The area of sea ice, first of all, depends on the ocean surface temperature (TPO) and the near-surface air temperature (PTW). When analyzing the temperature time series, it was determined that the appearance of two or more increments with the same sign in a row is 2 times more rare than the appearance of two increments in a row with opposite signs [1]. This indicates the presence of a certain stabilizing feedback in the interannual variability arising under the influence of the internal stochastic dynamics of the atmosphere. Earlier studies have revealed two interesting facts. Firstly, the observed regularity in the alternation of signs of differences in annual values was observed for the climatic series of the average monthly temperature at individual observation points [2]. Secondly, such a pattern is characteristic of a series of random numbers, which is proposed to be used as a test to check the studied series for randomness [3; 7]. The analysis of the temperature characteristics of the climate [1] showed that the common properties in the sequence of signs of the differences of random and climatic series are the result of the same feedback acting on stochastic variability limited by external conditions. From a mathematical point of view, this phenomenon should be defined as Markov properties of bounded random sequences. From the point of view of the study of the natural system or its components, it serves as a confirmation of their internal stability. As follows from the Markov properties, the probability of different signs in the neighboring first differences of the same time series is 2/3, and the probability of identical signs is two times less, that is 1/3. These probabilities characterize in terms of a homogeneous Markov chain the final state after one step (the first differences). We use the formula for a homogeneous Markov chain [6]:  = =
(where  is the matrix of probabilities of the final state; is the matrix of probabilities of the final state;  – the matrix of probabilities of the initial state; – the matrix of probabilities of the initial state;  – the matrix of transition probabilities). The matrix of transition states will look like this: – the matrix of transition probabilities). The matrix of transition states will look like this:
Using transient probabilities, the probability of any sequence of signs can be calculated. In general, the probability of a sequence of the first differences with "n" identical signs can be calculated by the formula 
Thus, the statistical properties of climate series, the values of which can be considered as independent, are close to the properties of bounded random sequences. The first differences of such a sequence have a Markov property reflecting the feedback effect in the stochastic model generating this sequence. This feedback in the first differences leads to the fact that the probability of changing the sign of the first differences is 2 times higher than the preservation of the sign. The appearance of feedback is caused by the influence of external constraints on the stochastic dynamics of models (natural systems and their components). In relation to the natural system and its components (one of which is sea ice) these properties confirm its internal stability and create a certain prognostic potential. Indeed, using the property of changing the sign of the first differences, it is possible to predict the sign of the increment of the characteristic for the year ahead. We applied these concepts to the analysis of the interannual variability of the sea ice area. Monthly (for March and September) values of the sea ice area in 1x1 cells from 1901 to 2029, represented by a series of annual values, were considered as the studied characteristics. It is known that March and September are periods, respectively, of maximum and minimum sea ice distribution in the seas of the Russian Arctic and in the Northern Hemisphere as a whole. In contrast to the above ideas about calculating probabilities for two possible variants of the first difference (plus or minus sign), we determined the probability for three possible variants of differences: plus, zero and minus. The probability of each variant of the last difference was determined for 12 groups (Table 1) of previous combinations of signs of interannual variability – difference (the previous year was subtracted from the current year): The groups under consideration of the preceding combinations of signs of interannual variability (the difference of consecutive annual values) and zero have the following form: | ---- | --- | -- | - |
| 0000 | 000 | 00 | 0 | | ++++ | +++ | ++ | + | That is, according to the data array, the probability of the appearance of a difference sign or zero for the array was determined after each of the presented combinations (groups) of previous differences in the interannual variability of the sea ice area. The area of sea ice is represented in the data array as a percentage of the cell area. Thus, two time series were analyzed for each cell of the array – for March (maximum area) and September (minimum area of sea ice). Theoretically, the probability of occurrence of one of the three options ("plus", zero, "minus") is 1/3. However, as follows from Markov chains, this probability depends on the sign of the previous difference. The Markov property of increment signs is their dependence on the signs of the preceding increments. Determining the nature of the dependence of the probability of occurrence of one of the three variants in the interannual variability of the sea ice area for the combinations (groups) of previous differences presented above was the main task of the work. RESULTS AND THEIR DISCUSSION Analysis of the probability of the sign of the difference in annual values for March following combinations of previous differences shows that with an increase in the number of signs of the same name in combination, the probability of a difference with the opposite sign increases (Table 1). For zero values, the probability of a zero difference increases with an increase in the number of zero differences in the preceding group. Table 1. Distribution and probability of occurrence of signs of difference and zero after the previous groups of signs and zeros in the interannual variability for March | Group | Quantity, units. | Probability, % | | "plus" | "minus" | 0 |
"plus" | "minus" | 0 | | ---- | 221 | 36 | 23 | 78,929 | 12,857 | 8,214 | | --- | 1424 | 289 | 250 | 72,542 | 14,722 | 12,76 | | -- | 7418 | 2047 |
2633 | 61,316 | 16,920 | 21,764 | | - | 41215 | 14622 | 24402 | 51,365 | 18,223 | 30,412 | | 0000 | 1757 | 773 | 11571 | 12,460 | 5,482 | 82,058 | | 000 | 3286 |
1342 | 17859 | 14,613 | 5,968 | 79,419 | | 00 | 7178 | 4477 | 30987 | 16,833 | 10,499 | 72,668 | | 0 | 26099 | 16604 | 74761 | 22,219 | 14,135 | 63,646 | | ++++ |
85 | 294 | 60 | 19,362 | 66,970 | 13,667 | | +++ | 456 | 1419 | 225 | 21,714 | 67,571 | 10,714 | | ++ | 2203 | 8825 | 1666 | 17,355 | 69,521 |
13,124 | | + | 15002 | 49874 | 16341 | 18,472 | 61,408 | 20,120 | On average, over the entire array, the probability of a plus sign appearing after one negative difference is 51.4% and it increases to 78.9% after four previous negative differences. The range of probability variation is 27.6%. The probability of a positive difference, therefore, increases on average by 9.2% after each increase in the number of previous negative differences in the group. At the same time, the probability of a negative difference remains in the range from 18.2% (after one negative difference) to 12.9% (after a combination of four negative differences). The probability of a zero difference, respectively, decreases from 30.4% to 8.2%. The probability of a negative difference appearing after one positive one is 61.4% and it increases to 67.0% after four negative differences. Thus, the probability of occurrence of negative differences after positive changes in a narrower probability range (5.5%) compared with the probability of occurrence of a positive difference after the previous negative (27.6%). In other words, the probability of positive differences appearing in March after negative ones (reflecting a reduction in the area of sea ice) depends more noticeably on the sign of the preceding differences than the probability of negative differences appearing after positive ones (reflecting an increase in the area of sea ice). Also, in a narrower range, the probability of positive differences after the previous positive ones remains (from 17.4% to 21.7%). That is, the probability of a positive difference does not change much with an increase in the previous positive differences. The probability of occurrence of zero values of the difference after the previous positive changes in the range from 20.1% to 13.7% (Table 1). An increase in the probability of a positive (negative) sign difference with an increase in the number of previous negative (positive) differences confirms the existence of a stabilization mechanism in the interannual variability of the sea ice area. This mechanism restrains the tendency to reduce the area of sea ice, determined by an increase in the intensity of meridional radiative heat transfer associated with a decrease in the inclination of the Earth's axis of rotation in the modern era [15]. A different picture of the probability distribution is noted for zero combinations (groups of preceding differences). There is an increase in the probability of a zero difference from 63.6% after one zero difference to 82.1% after four previous zero values. This distribution pattern reflects the existence of areas with no interannual changes in the area of sea ice and the stability of the ice mass in March. Numerical values of interannual variability were calculated and analyzed for positive and negative differences (Table 2). For zero differences, of course, the amplitude is 0. Interannual variability was determined by subtracting the previous year from the current one. The maximum (average for all cells) positive values of the interannual variability of the sea ice area in March are noted in the differences following the groups of three and four preceding negative differences – 16.0% and 15.8%, respectively. The interannual negative differences in these cases are significantly smaller (-6.3% for both cases). Also, the maximum positive values of the final difference are noted after groups of three and four positive differences (16.0% and 17.3%, respectively). In these cases, the maximum negative differences are also noted (-18.7% and -23.2%, respectively). Table 2. The average value of interannual variability for a cell for its sign after groups of combinations of previous signs in March. | Group |
Average value of interannual variability, % | | + | - | | ---- | 15,8190 | -6,3056 | | --- | 15,9803 | -6,2941 | | -- | 12,0901 | -6,4533 | | - | 9,8709 | -5,8350 | | 0000 | 1,4206 | -15,8241 | | 000 | 1,8646 |
-14,4396 | | 00 | 1,6194 | -9,7087 | | 0 | 2,4859 | -7,9116 | | ++++ | 17,2941 | -23,2313 | | +++ | 15,9671 | -18,7421 | | ++ | 13,9573 | -10,9763 | | + | 10,6506 | -7,6316 | Note: the value of the interannual variability of the sea ice area is measured in % of the cell area.
The negative difference following the groups of zero values, modulo significantly exceeds the positive difference value following the same zero group (Table 2). The maximum negative differences follow the groups of three and four zero differences: -14.4% and -15.8% respectively. The values of the positive differences following the zero groups do not exceed 2.5%. Thus, the negative values of the differences following the group of zero values, on average modulo, are approximately 6.5 times higher than the values of the positive differences following the zero groups. The values of negative interannual variability practically do not depend on the number of positive differences in the previous groups (change in the range from 5.8% to 6.3%). At the same time, the values of positive differences following groups of negative differences increase with the increase in the number of differences in the group. Thus, the average value of interannual variability after one previous positive difference is -7.8%, and after a series of four positive differences is already -23.2%. A similar dependence is manifested for positive values of the difference following the positive differences. After one previous positive difference, the average values of interannual variability is 10.7%, after four positive differences – 17.3%. Analysis of the probability of the sign of the difference of annual values for September (as for March) following combinations of previous differences shows that with an increase in the number of signs of the same name in the group, the probability of a difference with the opposite sign increases (Table 3). For zero values, the probability of a zero difference increases with an increase in the number of zero differences in the preceding group. The probability of positive differences in interannual variability after negative groups in September increases compared to March. The probability of a positive sign of interannual variability increases from 62.5% after one to 82.5% after four previous negative differences. However, the probability range is narrowed to 20% compared to 27.6% in March. Table 3. Distribution and probability of occurrence of signs of difference and zero after the previous combination of signs and zeros in the interannual variability for September | Group | Quantity, units. | Probability, % | | "plus" | "minus" | zero | "plus" | "minus" | zero | | ---- | 378 | 51 | 29 |
82,533 | 11,135 | 6,332 | | --- | 2198 | 458 | 216 | 76,532 | 15,947 | 7,521 | | -- | 11654 | 2994 | 1440 | 72,439 | 18,610 | 8,951 | | - | 46816 | 19653 | 8405 |
62,526 | 26,248 | 11,226 | | 0000 | 110 | 627 | 7773 | 1,293 | 7,368 | 91,340 | | 000 | 358 | 1355 | 10911 | 2,836 | 10,734 | 86,431 | | 00 | 1476 | 3505 | 18544 |
6,274 | 14,899 | 78,827 | | 0 | 10469 | 14582 | 42635 | 15,467 | 21,544 | 62,989 | | ++++ | 47 | 453 | 81 | 8,090 | 77,969 | 13,941 | | +++ | 591 | 2471 | 559 |
16,321 | 68,241 | 15,438 | | ++ | 3735 | 11714 | 2928 | 20,324 | 63,743 | 15,933 | | + | 22345 | 42642 | 14413 | 28,142 | 53,705 | 18,152 | On the contrary, the probability range of negative values appearing after groups of positive differences increases to 24.3% (compared to 5.5% in March). The probability of a negative interannual difference in September varies from 53.7% (after one previous positive difference) to 78.0% (after a series of four positive differences). Thus, the probability range for the appearance of positive differences after negative groups in March is greater than in September. Conversely, the probability range of occurrence of negative differences after the previous positive ones in September is greater than in March.
In addition, the probability range for the appearance of zero values increases from 18.4% in March to 28.3% in September. At the same time, the dependence of the nature of the probability distribution of zero values on the previous differences, as in March, is different than for the appearance of opposite signs. In the case of signs, there is an increase in the probability of occurrence of an interannual difference of one sign with an increase in the group of previous differences of another sign. For the probability of occurrence of zero differences (absence of interannual variability) for March and September, there is an increase in the probability of occurrence of zero values with an increase in the group of preceding zero differences. The first feature (for opposite signs) reflects a stable component in the stochastic interannual variability of the sea ice area. The second feature (for zero values) reflects the presence of stable areas in the ice mass that are not subject to interannual changes. Numerical values of interannual variability for positive and negative differences in September were also calculated and analyzed (Table 4). For September, there is a feature of a decrease in the values of the negative interannual difference with an increase in the number of negative previous differences in the group. So, after one negative difference, the average value of interannual variability is -7.7%, while after four negative differences it decreases to -3.6%. In March, this feature does not manifest itself. Also (as for March), there is no dependence of the value of positive differences following negative ones on the number of preceding positive differences in the group. However, (as in March), the peculiarity of increasing the values of negative interannual variability from the number of previous positive differences in the group is manifested. So after one positive difference, the average negative value of the interannual variability for the cell is -14.9%, after four positive differences it is already -30.6%. Table 4. The average value of interannual variability for a cell for its sign after groups of combinations of previous signs in September. | Group | Average value of interannual variability, % | | + | - | | ---- | 13,5291 | -3,6471 | | --- | 15,5669 | -4,5175 | | -- | 14,6221 | -6,0979 | | - |
15,8042 | -7,7275 | | 0000 | 2,6455 | -34,0670 | | 000 | 3,2374 | -30,4598 | | 00 | 5,5976 | -25,3966 | | 0 | 6,8032 | -17,6330 | | ++++ | 27,9574 | -30,6313 | | +++ | 15,4738 | -21,4937 | | ++ |
18,2851 | -15,4723 | | + | 14,6587 | -14,9141 | Just as for March, the dependence of the value of positive differences in interannual variability on the number of previous positive differences in the group is noted. So, after one positive difference, the average (for a cell) value of interannual variability is equal to 14.7%, after four positive differences – 28%. Thus, in March and September, after positive differences with an increase in the number of differences in the group, the values of subsequent, both positive and negative interannual changes increase. Average modules of interannual variability were calculated for each cell of the ice data array (Fig. 1). 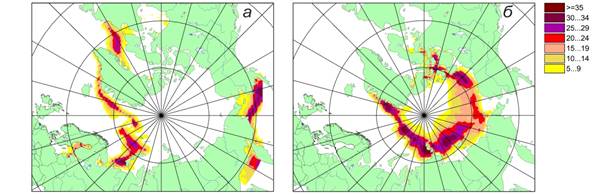
Fig. 1. Average modules of interannual variability of the sea ice area, % of the cell area. It is known that in March there is a seasonal maximum of sea ice distribution in the Northern Hemisphere and a minimum of interannual variability [11; 14]. Nevertheless, against the general little-changing background, at this time there are areas in which there is a noticeable interannual dynamics of the area of sea ice. These areas are confined to stable sea currents (Fig. 1 a). Noticeable interannual variability of the sea ice area in March is observed in the Labrador Sea and the Davis Strait. This variability is probably related to the dynamics of the West Greenland Current [8]. The interannual variability in the distribution of sea ice is observed in the Danish Strait and the Greenland Sea, which is determined by the dynamics of the West Greenland Current and the Irminger Current. The sea ice area also changes in March in the eastern and northern parts of the Barents Sea, which is associated with the Norwegian Current. The area of sea ice in the Bering and Okhotsk Seas is also subject to interannual changes in March. In the Bering Sea, interannual changes in the distribution of sea ice are obviously associated with the dynamics of the Kuroshio Current, in the Sea of Okhotsk – with the instability of the West Kamchatka Current. If in March the interannual variability in the Arctic space is fragmentary, then in September a different picture is observed. The interannual variability of the sea ice area in September forms a circumpolar region adjacent from the south approximately to the boundary of the distribution of long-term ice (Fig. 1b). In the area of long-term ice located in the center of the Arctic basin and limited by a zone of noticeable interannual changes, interannual changes in the area of sea ice are not manifested. The noted nature of localization of the area of noticeable interannual variability in September is associated with the seasonal course of insolation and, mainly, the meridional direction of seasonal reduction of the area of sea ice. conclusion With an increase in the number of the same signs of interannual variability in the group, the probability of a difference with the opposite sign increases. For zero values, the probability of a zero difference increases with an increase in the number of zero differences in the preceding group. Thus, the nature of the dependence of the probability of the sign of interannual variability on the number of preceding signs for positive and negative signs differs from the nature of the dependence for zero values. In the case of signs, there is an increase in the probability of the appearance of an interannual difference of one sign with an increase in the group of previous differences of another sign. For the probability of occurrence of zero differences (absence of interannual variability) for March and September, there is an increase in the probability of occurrence of zero values with an increase in the group of preceding zero differences. The performed studies have shown that the probability range for the appearance of positive differences after negative groups in March is greater than in September. Conversely, the probability range of occurrence of negative differences after the previous positive ones in September is greater than in March. In March and September, during periods of minimum and maximum interannual changes, respectively, after positive differences with an increase in the number of differences in the group, the values of subsequent, both positive and negative interannual changes increase. March is characterized by a fragmentary spatial arrangement of areas with a noticeable interannual variability in the distribution of sea ice, which are localized in areas of sea currents and are associated with their interannual dynamics. The interannual variability of the sea ice area in September forms an extensive circumpolar region adjacent to the border of the distribution of perennial ice from the south. This location of the area of noticeable interannual variability is mainly due to the meridional seasonal reduction in the area of sea ice distribution in accordance with the meridional seasonal change in insolation.
The results obtained indicate the presence of regularity in the stochastic interannual variability of the sea ice area – a stabilization mechanism, which is confirmed by an increase in the probability of the appearance of a difference of one sign, with an increase in the number of previous differences of another sign in the group. An increase in the probability of zero values with an increase in the number of previous zero differences confirms the presence of geographical areas in which there are no interannual changes in the area of sea ice. The conducted studies can contribute to increasing the reliability of forecasts of the interannual variability of the sea ice area in the Northern Hemisphere, during periods of their maximum and minimum seasonal distribution. Thanks. The work was carried out in accordance with the state budget themes "Evolution, current state and forecast of development of the coastal zone of the Russian Arctic" (121051100167-1) and "Geographical foundations of sustainable development of energy systems using renewable energy sources" (121051400082-4)
References
1. Alekseev, G.V., Svyaschennikov, P.N. (1991). Natural Variability of the Climate Parameters of the northern polar area and Northern Hemisphere. L.: Hydrometeoizdat.
2. Altgovazen, Z.R. (1976). Statistical Characteristics of the Interannual Variability of Average Monthly Air Temperatures. Meteorology and Hydrology, 10, 30-35.
3. Box, D., Jenkins, G. (1974). Time Series Analysis. Forecast and management. Issue 1. Moscow: Mir.
4. Zakharov, V.F. (1981). Arctic Ice and Modern Natural Processes. L.: Hydrometeoizdat.
5. Kondratiev, K.Ya. (1992). Global Climate. St. Petersburg: Nauka.
6. Kemeny J., Snell J. (1970). Finite Markov Chains. Moscow: Nauka.
7. Kendall, M. (1983). Time Series. Moscow: Finance and Statistics.
8. Lebedev, A.A., Uralov, N.S. (1977). Hydrometeorological Conditions for the Formation of an ice Anomaly in the Davis Strait. Proceedings of AANII, 341, 53-72.
9. Ice Formations in the Western Arctic Seas. Zubakin, G.K. (Ed.). (2006). St. Petersburg, AARI.
10. Monin, A.S. (1982). Introduction to the Theory of Climate. Leningrad: Hydrometeoizdat.
11. Sea Ice. Frolov, I.E., Gavrilo, V.P. (Eds.). (1997). St. Petersburg, Gidrometeoizdat.
12. Fedorov, V.M., Grebennikov, P.B., & Frolov, D.M. (2020a). Analysis of Responses in the Dynamics of the Sea Ice Area of Certain Arctic Regions to Changes in Insolation. Arktika I Antarktika, 2. doi:10.7256/2453-8922.2020.2.3.31875
13. Fedorov, V.M., Grebennikov, P.B., & Frolov, D.M. (2020b). Assessment of the Role of the Insolation Factor in Changes of the Sea Ice Area in Russian Arctic. Earth’s Cryosphere, 24, 3, 38-50. doi:10.21782/KZ1560-7496-2020-3(38-50)
14. Fedorov, V.M., & Grebennikov, P.B. (2021). Long-term Changes in the Area of Sea Ice in the Northern Hemisphere due to Changes in the Characteristics of Insolation. Earth’s Cryosphere, 25, 2, 38–47. doi:10.15372/KZ20210204
15. Fedorov, V.M. (2020). Evolution of the Modern Global Climate of the Earth and Its Probable Causes. GeoRisk, XIV, 4, 16-29. doi:10.25296/1997-8669-2020-14-4-16-29
16. Shuleikin, V.V. (1953). Sea Physics. Moscow, AN SSSR.
17. Rayner N.A., Parker, D.E., & Horton E.B. et al. (2003). Global Analysis of Sea Surface Temperature, Sea Ice, and Night Marine Air Temperature since the Late Nineteenth Century. J. Geophys. Res., 108, D14, 4407. doi:10.1029/2002JD002670
18. Retrieved from http://www.metoffice.gov.uk/hadobs/hadisst/data/download.html
Peer Review
Peer reviewers' evaluations remain confidential and are not disclosed to the public. Only external reviews, authorized for publication by the article's author(s), are made public. Typically, these final reviews are conducted after the manuscript's revision. Adhering to our double-blind review policy, the reviewer's identity is kept confidential.
The list of publisher reviewers can be found here.
The subject of the study, according to the author, is the regularities of the peculiarities of the interannual variability of the area of sea ice in the Northern Hemisphere. The methodology of the study, the article indicates the use of the database of the Hadley Meteorological Center, compiled using empirical orthogonal functions and data from instrumental and visual (primarily ship and satellite) observations. Based on algorithms for approximation and extrapolation of available data (digitized maps of the sea ice area, data from ship and satellite observations), taking into account ocean surface temperature, the reconstruction of the sea ice area was carried out, a technique based on Markov properties of natural variability was used, as well as mathematical and statistical methods with an assessment of the probability of events. The relevance of the topic raised is unconditional and consists in obtaining information about the dynamics of sea ice, which depends on many factors determined by geophysical processes - air temperature and humidity, ocean surface temperature, atmospheric circulation processes, sea currents, the presence and structure of halocline, cloud cover, river flow, albedo, etc. The basis of these factors is the solar radiation coming to Earth. This may be useful from the point of view of their participation in thermal cycles, which have not been fully investigated in northern ecosystems, and secondly, the study is relevant in connection with the economic development of the Arctic zone, where numerous industrial productions are concentrated. The scientific novelty lies in the attempt of the author of the article, based on the conducted research, to conclude about spatial and temporal features indicating the presence of regularities in the interannual variability of the characteristics of the state of the natural environment., for the Arctic Ocean, a close relationship was found between the annual course of the average module of interannual variability of the area of sea ice with the annual course of irradiation of the Northern Hemisphere with a shift of 2 months. Spatial and temporal features in the interannual variability of the sea ice area in the Northern Hemisphere have been identified based on the analysis of an array of ice data. Style, structure, content the style of presentation of the results is quite scientific. The article is provided with rich illustrative material reflecting the process of interannual variability of the sea ice area in the Northern Hemisphere, which can contribute to increasing the reliability of forecasts during periods of their maximum and minimum seasonal distribution. The article contains a variety of interesting illustrative material in the form of tables, figures, diagrams. The bibliography is very comprehensive for the formulation of the issue under consideration, but does not contain references to normative legal acts and methodological recommendations. The appeal to the opponents is presented in identifying the problem at the level of available information obtained by the author as a result of the analysis. Conclusions, the interest of the readership in the conclusions there are generalizations that made it possible to apply the results obtained. The target group of information consumers is not specified in the article.
Link to this article
You can simply select and copy link from below text field.
|
|