|
MAIN PAGE
> Back to contents
Arctic and Antarctica
Reference:
Vasil'chuk Y.K., Ginzburg A.P., Tokarev I.V., Budantseva N.A., Vasil'chuk A.C., Palamarchuk V.A., Bludushkina L.B., Slyshkina E.S.
Morphology of the Buluus, Ulakhan-Taryn aufeis, conditions of its occurrence and stable oxygen and hydrogen isotope variations in the lower part
// Arctic and Antarctica.
2024. № 1.
P. 34-61.
DOI: 10.7256/2453-8922.2024.1.70079 EDN: ICABMG URL: https://en.nbpublish.com/library_read_article.php?id=70079
Morphology of the Buluus, Ulakhan-Taryn aufeis, conditions of its occurrence and stable oxygen and hydrogen isotope variations in the lower part
Vasil'chuk Yurii Kirillovich
ORCID: 0000-0001-5847-5568
Doctor of Geology and Mineralogy
Professor, Lomonosov Moscow State University, Faculty of Geography, Department of Landscape Geochemistry and Soil Geography
119991, Russia, Moscow, Leninskie Gory str., 1, of. 2009

|
vasilch_geo@mail.ru
|
|
 |
Other publications by this author
|
|
Ginzburg Alexander Pavlovich
Junior Researcher, Scientific Center for Arctic Studies; Postgraduate student, Institute of Physicochemical and Biological Problems of Soil Science of the Russian Academy of Sciences
629007, Russia, Salekhard, Republic str., 20
|
|
alexandrginzburg13154@yandex.ru
|
|
 |
Other publications by this author
|
|
Tokarev Igor' Vladimirovich
PhD in Geology and Mineralogy
Leading Specialist, Resource Center "X-ray Diffraction Research Methods" of the Science Park of St. Petersburg State University
199034, Russia, Saint Petersburg, Universitetskaya str., 7
|
|
tokarevigor@gmail.com
|
|
 |
Budantseva Nadine Arkad'evna
ORCID: 0000-0003-4292-5709
PhD in Geography
Senior Researcher, Department of Landscape Geochemistry and Soil Geography, Faculty of Geography, Lomonosov Moscow State University
119991, Russia, Moscow, Leninskie Gory str., 1, office 2007
|
|
nadin.budanceva@mail.ru
|
|
 |
Other publications by this author
|
|
Vasil'chuk Alla Constantinovna
ORCID: 0000-0003-1921-030X
Doctor of Geography
Leading Scientific Associate, Lomonosov Moscow State University, Faculty of Geography,
Laboratory of Geoecology of the Northern Territories
119991, Russia, Moscow, Leninsky Gory str., 1, office Z10
|
|
alla-vasilch@yandex.ru
|
|
 |
Other publications by this author
|
|
Palamarchuk Valentina Anatol'evna
Junior Researcher, Scientific Center for Arctic Studies and Institute of the Earth's Cryosphere of the Tyumen Scientific Center SB RAS
629007, Russia, Salekhard, Republic str., 20
|
|
VAPalamarchuk@yanao.ru
|
|
 |
Bludushkina Lyubov' Bakhtiyarovna
Junior Researcher, Lomonosov Moscow State University, Faculty of Geography,
Laboratory of Geoecology of the Northern Territories
119991, Russia, Gorod, Leninskie Gory str., 1, office 10
|
|
bludushkina19@mail.ru
|
|
 |
|
Slyshkina Elena Sergeevna
Junior Researcher, Lomonosov Moscow State University, Faculty of Geography,
Laboratory of Geoecology of the Northern Territories
119991, Russia, Gorod, Leninskie Gory str., 1, office 10
|
|
lena.slyshkina@gmail.com
|
|
 |
|
DOI: 10.7256/2453-8922.2024.1.70079
EDN: ICABMG
Received:
07-03-2024
Published:
10-04-2024
Abstract:
Aufeis is one of the most dangerous natural phenomena. The negative impact of aufeis is determined by the unexpected flooding of the territory and subsequent freezing of water, the formation of ice barriers, the icing of underground structures and communications (mines, tunnels, culverts, and sewer wells), as well as the icing of roads and railways, coastal hydraulic structures, etc. There are cases when explosions of aufeis mounds produce catastrophic disturbances within a few seconds. The aufeis that forms annually in the valley of the Buluus Creek is one of the most famous and studied aufeis of Central Yakutia. The aufeis was sampled from a vertical section. The aufeis is layered, and the thickness of the layers is 3-10 cm. In the upper part of the aufeis, the ice layers are thicker than in the lower. Sampling from the aufeis ice was carried out using a 5.1-cm-diameter steel crown driven by a Bosch electric drill. Measurements of the isotopic composition of oxygen and hydrogen in ice were performed using a Picarro L 2130-i laser isotope analyzer. The isotopic composition of the Buluus ice varies in a narrow range: δ18O values vary from −20.2 to −21.9‰, δ2H values vary from −159.5 to −173.7‰. Generally, the ice is isotopically slightly enriched compared to the surface water of the Ulakhan-Taryn creek, where the δ18O value is −22.18‰ and the δ2H value is −175.1%. Groundwater is isotopically close to the creek water; its isotope composition is also isotopically enriched compared to the ice of the aufeis, with δ18O values varying from −22.17 to −22.25‰ and δ2H values varying from −173.7 to −175.1‰.
Keywords:
aufeis, permafrost, oxygen isotope, hydrogen isotope, Buluus, Ulakhan-Taryn stream, Lena River, cryogenic soils, middle taiga, Central Yakutia
This article is automatically translated.
You can find original text of the article here.
Introduction Ice is one of the most dangerous natural phenomena. The negative impact of ice is determined by the unexpected flooding of the territory and subsequent freezing of water, the formation of ice barriers, icing of underground structures and communications (mines, tunnels, culverts and sewer wells), as well as icing of roads and railways, coastal hydraulic structures, etc. There are cases when explosions of ice heave mounds produced catastrophic disturbances within a few seconds.[1]. V. G. Petrov[24] in March 1928, on the Onon River in the Amur region, an explosion of an ice heave mound was observed, during which a block of ice with soil up to 19 m long, 5 m wide, 2 m thick, weighing up to 200 T. I. I. Puzanov in 1936 was thrown out on the river. Gilinde recorded an explosion, after which blocks of ice weighing up to 50 tons were carried away by a stream of water for several kilometers. V. F. Dershholz in 1971 He described the explosion of river ice on the river Zee, during which a caravan of horses along with its accompanying people died. On March 28, 1927, during the explosion of an ice mound in the valley of the The total volume of the ice-ground mass ejected by the explosion was 508 m3. The largest block of ice with layers of sand, gravel and pebbles was 2 m thick, 6-9 m wide and 18 m long[8]. H.Kraits and co-authors [36] studied the ice of the Canadian cryolithozone in northwestern Canada (on an area of 618,430 km2) on the basis of 573 Landsat images (1985-2017) and determined using hydrometric data the contribution of winter baseline runoff to the total annual runoff of 17 rivers in the studied region. The 1402 glaciers mapped are found mainly in the foothills of severely disturbed karst mountain areas in the zone of continuous permafrost distribution. Winter base runoff and its contribution to annual discharge were lower in the catchments of continuous permafrost distribution than in the zone of intermittent permafrost distribution, but generally increased over the period 1970-2016. The distribution of ice is apparently sensitive to winter air temperatures and winter base runoff conditions, and ice located on the southern border of the continuous permafrost distribution is more sensitive to the degradation of permafrost and the projected increase in winter base runoff. The glaciers in the Tso Moriri basin of Eastern Ladakh in India were mapped by D.Brombirstoidl and colleagues [32] using freely available Landsat and Sentinel-2 data. A total of 27 ice fields with an average area of 9 km2 have been identified. Although the occurrence of ice is highly variable on a seasonal and interannual scale, but ice bodies form in the same place from year to year. In addition to the waters of the river and groundwater, the waters of nearby glaciers can be a source of water for ice deposits. A.McDonald and co-authors[42] showed that a significant change in the isotopic composition in the river fed from the rapidly retreating Virkisjokull outlet glacier in Iceland is recorded twice a year: in summer (values ?18 O= -11.2, ?2 H= -78%) and in winter-early spring (value ?18 O= -10.7%, ?2 H = -74.9%). This pattern is also observed individually for both monitoring sites in the river and indicates that winter runoff is partially supported by local groundwater stored in moraines. A.Chesnokova and co-authors [34] investigated the isotopic composition of glaciers in the upper reaches of the Duke River Valley in the St. Elias Mountains, Yukon. The research results have shown that by studying hydrological objects that remain active in winter, it is possible to determine the hydrological sources of ice formation and establish the contribution of various sources to the studied ice. As expected, the ice formed near the end of the main glacier is fed by the meltwater of the glaciers. However, even in the vicinity of the glacier, the involvement of non-glacier water sources is very noticeable, such as water tributaries on hillsides fed by groundwater, buried glacial formations, and moraine lakes. Among the main glaciers, the contribution of groundwater and small glacial tributaries is more pronounced and becomes the main source of ice formation in the alpine-meadow part of the watershed. Some of the slope tributaries within the Alpine meadow seem to be fed by the water of the permafrost layer.[34]
In the images obtained using the slow-motion camera A.Chesnokova and co-authors [34] observed ice in the upper reaches of the Duke River Valley in the St. Elias Mountains of the Yukon, which the glacier contributes to the formation of ice. Based on this conclusion, they used the isotope ratios of the second ice and glacier on the co-isotope diagram of the ratio ? 2 H–? 18 O. Due to cryogenic fractionation, ice samples and source source samples may have different isotopic characteristics and potentially be located further apart on the co-isotope diagram of the ? 2 H–? 18 O ratio; this methodology helped to eliminate potential false results. For example, a sample from a moraine lake cannot be excluded as a potential parent source of Icing PF, since it is located within the specified range, and the sample of the western moraine with an ice core is located further from the ice sample, so its contribution is small.[34] The isotopic composition of the glaciers in the upper reaches of the Duke River Valley in the St. Elias Mountains of the Yukon[34] is as follows: the first ice has values of ? 18 O ? -24.2%, the value of ? 2 H ? -184%; the second ice has values of ? 18 O ? -23.6 %, the value of ? 2 H ? -182 % At the same time, the water from the well showed values of ?18 O ? -22.7, the value of ?2 H ? -175, therefore, snow water and glacier meltwater participated in the composition of the ice.
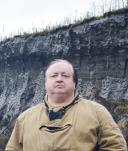
Coastal hydraulic structures (berths, overpasses, piers, etc.) are often destroyed under the influence of static pressure of ice.[1,2,3] Interest in the study of glaciers has grown in recent years,[32,34,36,38,40,43,44] since glaciers serve as indicators of water exchange processes in the territory occupied by permafrost rocks and can play an important role in assessing the state of the cryosphere in a changing climate. The authors studied the isotopic composition of the Ulakhan-Taryn ice in order to study the conditions of its formation. Physical and geographical conditions of the research area Geographical location of the research area The site of the field work was located near the southern border of the Bestyakhskaya terrace on the right bank of the Lena River (Fig. 1, a). Two key sections are distinguished within the territory: Ulakhan-Taryn creek (61°34’49.86” s.w., 129°32’7.64” v.d.) and Buluus ice (61°20’17.47” s.w., 129°4’22.13” v.d.) (Fig. 1,b,c, 2). The plots are concentrated along the federal highway A-360 "Lena" connecting the city of Skovorodino (Nevers) Amur region and Yakutsk. 
Fig. 1. Key research sites in the territory of Central Yakutia: a) approximate boundaries of the Bestyakhskaya terrace of the Lena River (according to [18]); b) the valley of the Ulakhan-Taryn stream; c) Buluus ice; 1 – boundaries of the Bestyakhskaya terrace; 2 – the Federal highway A-360 "Lena"; 3 – key research sites Relief The Bestyakhskaya terrace is the IV above-floodplain terrace of the Lena River, it has relative heights of 56-78 m above the average water level in the river and occupies most of the west of the Lena-Aldan interfluve (Fig. 1, a). The terrace is composed mainly of alluvial sandy deposits (thickness 60-70 m), with thick layers of rubble and pebbles (thickness 1-3 m).[18] It is believed that the Bestyakhskaya terrace stood out as an independent geomorphological element of the territory in the Late Pleistocene – Holocene, a significant role in its isolation was played by a complex of periglacial processes, especially glacioisostatic uplifts.[28] The genesis of the terrace is controversial.[25] The modern relief of the terrace surface is upland and flat, strongly dissected by deep cuts having a thermoerosion and suffusion and thermosuffusion origin.[22,25] The activity of groundwater largely determines the formation of a characteristic thermal diffusion relief here in the form of semi-enclosed circuses, the upper edges of which rise 20-30 m above the bottoms of streams, and the slope angle of their slopes is about 30 °.[12] At the moment, attenuation of thermal diffusion processes has been recorded,[12] which is accompanied by gradual overgrowth of sandy floodplain terraces of rivers in the Lena basin and its large tributaries. [12,23] Permafrost rocks Permafrost rocks in Central Yakutia have a continuous distribution, are characterized by high thickness, medium ice content and generally relatively stable condition.[20] The average temperatures of permafrost rocks at the depth of zero seasonal fluctuations are about -4 – -3 °C. Sandy massifs and areas of elevated above–floodplain terraces, composed of sands, are characterized by a specific thermal regime, which is characterized by very high temperatures - up to -0.2 ° C. The capacity of the cryolithozone here is approximately 200 m, in some places increasing almost twice.[5,22] The structure of the MMP thickness on the Bestyakhskaya terrace is two-layered, two frozen horizons are separated by an inter-frozen talik.[9] The thickness of the active layer on sandy watersheds reaches 3.5 m, in lowlands composed of heavier sediments, where powerful peat bogs are also present, it decreases to 1-1.5 m.[20] Climatic characteristics
The territory is characterized by a sharply continental climate. Long cold and snowless winters, short and very hot summers are typical. The average annual air temperature in the village of Pokrovsk (50 km south of Yakutsk), the nearest large settlement to the research site, is -9.6 °C. The warmest month of the year is July, during which the average for 90 years of meteorological observations (1933-2023) was 18.4 °C, the coldest is January, the average annual temperature of which is -39.8 °C. During the entire period of meteorological observations, two main features are distinguished: the average annual air temperature varied from -8.0 to -12.0 ° C in the period from 1933 to 1990, and since 1990 there has been an increase in the average annual air temperature, as well as a significant decrease in its annual amplitudes. The average amount of precipitation during the year is low, it is typical for a sharply continental climate and amounts to 200-300 mm/year. At the beginning of the period of systematic meteorological observations, in abnormal years, precipitation fell to 600-800 mm or more per year, but over the past almost 70 years, the average amount of precipitation falling in this area is 292 mm/year (Fig. 2). According to agro-climatic zoning, the Leno-Aldan interfluve belongs to the most heat-supplied regions of Yakutia, in which the annual amounts of average daily active temperatures (10.0 ° C and above) exceed 1200 ° C, and the frost-free period of the year lasts more than 90 days. As a result, the studied area is one of the few places on the territory of Yakutia in general where arable farming is possible.[6] 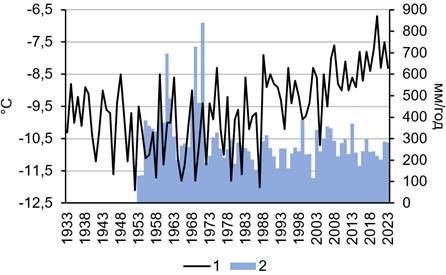
Fig. 2. Climatic characteristics in the village of Pokrovsk in the period from 1933 to 2023 (according to the Pokrovsk weather station, Yakutia[19] – systematic measurements of precipitation have been carried out only since 1951). 1 – air temperature, °C; 2 – precipitation level, mm/year Hydrological and hydrochemical characteristics and ice phenomena on rivers Lena is the largest river in Yakutia, as well as the whole of Eastern Siberia, and one of the largest rivers in Russia. The length of its main channel is more than 4,600 km. The source of the Lena is located in a small swamp on the Solntsepad plateau in the Eastern Baikal region, the mouth is on the coast of the Arctic Ocean, where the river has formed an extensive delta – also one of the largest among the rivers of Russia and the world (with an area of about 60,000 km2).[33] The annual flow of the Lena, according to various estimates, ranges from 489 to 542 km3, which corresponds to an average annual expenditure of 15,500 to 17,175 m3/s.[26] The widespread development of stable MMPs in the Lena River valley complicates its groundwater supply, however, in the Lena Delta in recent years this component of nutrition It occupies more and more shares in the structure of river flow.[33] In winter, the Lena is covered with ice in the direction from north to south, a significant ice thickness is achieved (about 5 m or more). Stable ice formation is typical in the period from mid-November to the second half of May. The spring ice drift is accompanied by frequent powerful ice jams and concomitant flooding of coastal areas.[11,17] There are no large tributaries between the points where large tributaries flow into the Lena – the Olekma (2,089 km from the mouth) and the Aldan (1,311 km from the mouth), mainly small rivers and streams flow into it. Numerous groundwater outlets in the rear seams of the slopes of the above-floodplain terraces and their unloading into streambeds leads to the formation of numerous glaciers.[7] The ice formed annually in the valley of the Buluus stream is one of the most famous and studied in detail glaciers of Central Yakutia[4,13,21,31] (Fig. 3,4). In addition, it is a popular natural phenomenon among tourists. After establishing stable positive air temperatures, the ice melts for a relatively long time. So, in June-July, the surface area of the ice is about 0.3–0.4 km 2, and the remainder of the ice can persist almost until the beginning of August (Fig. 3, a-d). At the beginning of the summer season, the thickness of the ice on the Buluus creek reaches 3-5 m, and in mid–July it decreases significantly - and is already 1-1.5 m. Buluus ice is attributed to one of the seven wonders of Yakutia. The total area of the ice is 1105 hectares. A unique source of groundwater forms glaciers of pure fresh water here, which do not melt even on the hottest days. On ice, the air temperature does not rise above +4-6 ° C. Ice seems to be a perfect fantasy on a hot summer day among green grass and tall coniferous trees. In summer, numerous crevices and caves form in the glacier. In winter, even in severe frosts, melt water outlets are visible on the surface. It happens that by autumn the Buluus ice melts completely, and in 2020 the Buluus completely melted very early — at the end of July, in 2022 the Buluus melted at the end of August. According to L.A. Gagarin's observations [12-14], the valley where Buluus is located is relatively narrow. During the winter, ice forms here with a large thickness and a small area. And the amount of heat that falls on this surface in summer is not enough to quickly melt such a volume of ice. If the Buluus had been wider and thinner, it would have melted earlier, i.e. how long the ice would melt here depends on its thickness and area. The thicker and smaller the area, the longer it will last. And, accordingly, the thinner and wider the ice, the faster it will melt. And what thickness and area this ice will be depends on three factors — the height of the snow cover, the temperature in winter and the amount of precipitation that fell the previous summer-autumn. If there is little snow and the winter is cold, water from a natural source freezes quickly, without having time to spread over the surface. And if there is a lot of snow and the winter is relatively warm, the water moves down the riverbed for a long time before freezing. The area of the ice increases, but at the same time its thickness is very small. At the same time, the ice melts faster. 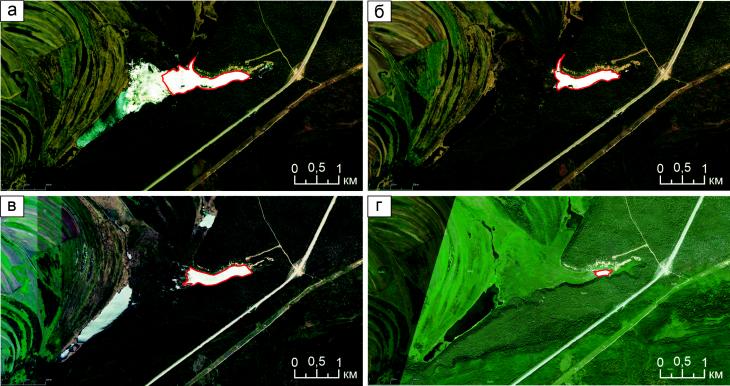
Fig. 3. Boundaries of the Buluus ice on multi-time satellite images: a) at the end of May 2022; b) in mid–June 2022; c) in early July 2022; d) in early August 2022; 1 - the boundaries of the ice area 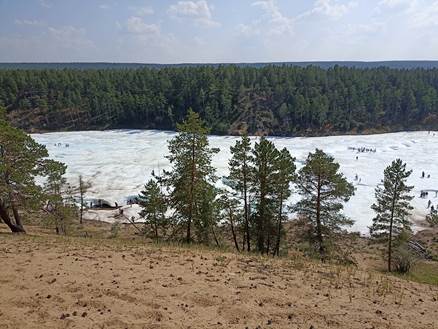
Fig. 4. The appearance of the valley of the Buluus creek, the surface of the ice and the surrounding Middle taiga landscape in early July 2023 (photo by A.P. Ginzburg) Soil cover of the territory The work area is located in the middle Taiga landscape subzone, therefore, permafrost-taiga fawn soils, including those rejuvenated in complexes with alasic soils, are considered the dominant type of soils in the Leno-Aldan interfluve.[6.30] Directly on the western part of the Bestyakhskaya terrace, the area of permafrost podzolic soils and boron sands is highlighted on the map from this atlas. According to A.P. Chevychelov[29], the territory of Central Yakutia is characterized by a complex soil cover, which includes 9 zonal, 2 azonal and 7 intrazonal soil types (Table 1). Such a variety of soils is provided by a large number of diverse soil-forming macroprocesses, which also occur against the background of cryogenesis of varying degrees, which is typical in general for Yakutia as on thawed and permafrost underlying rocks.[35] Table 1. Systematic list of cryogenic soil types in Central Yakutia (according to A.P.Chevychelov[29]) | Zonal | Azonal | Intrazonal | | 1. Podzols 2. Malt 3. Pale brown 4. Fawn 5. Chernozems 6. Meadow-chernozem 7. Chernozem-meadow 8. Turf meadows 9. Meadow-marsh | 1. Sod-carbonate 2. Humus-carbonate | 1. Alluvial layered 2. Alluvial gray humus 3. Alluvial dark humus 4. Swampy lowlands 5. Sapropels 6. Salt marshes 7. Salt shakers | A feature of the soil cover of the watersheds of Central Yakutia is the significant areas occupied by alasic ecosystems[27], within which the main agricultural activities are carried out.[16] Hydro- and halomorphic soil complexes are observed in the Alas basin, the soil cover of the Alas is represented by malt, meadow-chernozem and chernozem-meadow, meadow-marsh soils.[15] Alasian ecosystems, as well as their surrounding watersheds with permafrost-taiga soils and corresponding forest vegetation, are actively degraded due to climatic changes and the formation of deep thermokarst dips in sediments. Objects and methods Studied glaciers
The glacial ice studied at a key site in the valley of the Buluus Creek was selected from a vertical outcrop exposed as a result of natural lateral thawing of the glacial ice (Fig. 5,6). The conducted stripping of the outcrop showed that the ice has the following characteristic features: the ice is layered, alternating layers of transparent slightly bluish and greenish dense ice with a small number of visually prominent air bubbles with white almost non-transparent more brittle layers containing a large number of air bubbles and loosely bound ice grains. The thickness of the layers is 3-10 cm, in the upper part of the ice the layers are more powerful than in the lower (see Fig. 6). At about a depth of 65 cm from the surface, the ice is slightly polluted with large and medium pale yellow sandy material. The surface of the ice also contains fine and medium-sized sand, the appearance of which on it is quite possible due to the Aeolian transfer of mineral particles from the unpaved slopes of the terraces surrounding the valley of the Buluus creek (see Fig. 5). Otherwise, there was no visually pronounced contamination of ice by soil particles or other substances. 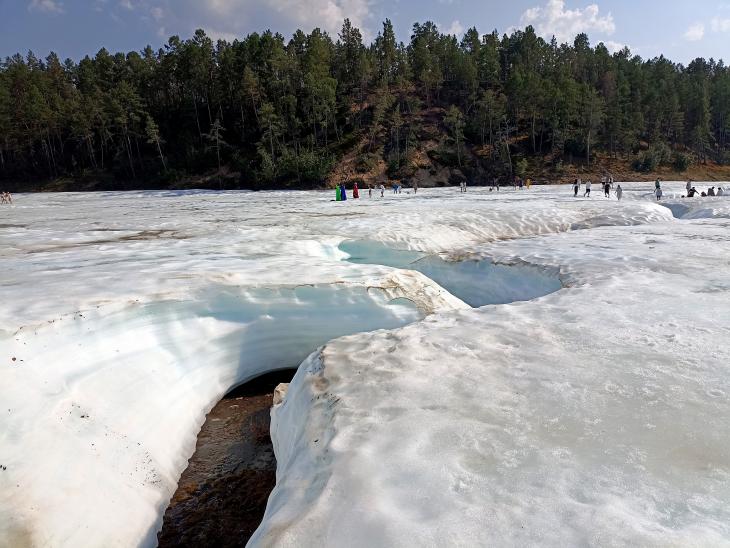
Fig. 5. The main channel of the Buluus creek and the washout formed in the body of the ice in early July 2023 (photo by V.A. Palamarchuk) 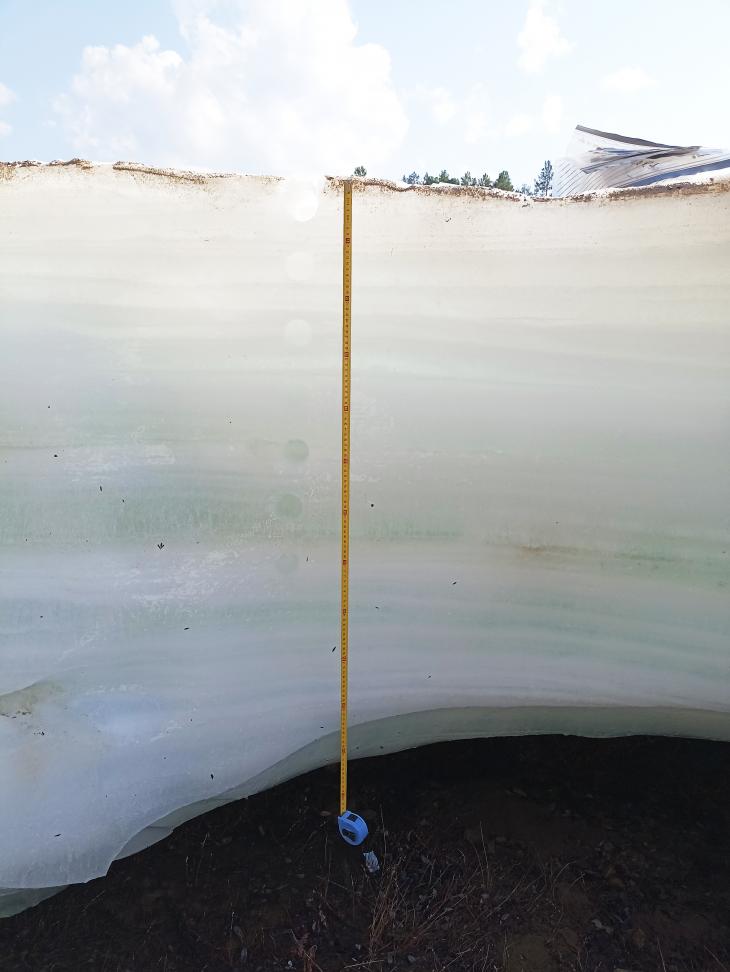
Fig. 6. Vertical exposure of glacial ice on the Buluus creek (photo by V.A. Palamarchuk) Field sampling of glacial ice Ice sampling from the ice layers was performed using a 5.1 cm diameter steel crown driven by a Bosch electric drill. The ice sample was drilled out of the vertical wall of the ice column, and the upper 1.5-2 cm of each core was removed to avoid falling into the sample of flowing ice, the isotopic composition of which was changed as a result of prolonged contact with atmospheric air. The mass of each ice sample was 100-150 g. After thawing at room temperature during the day, the meltwater was poured into plastic bottles with a volume of 10 ml. The vials were previously rinsed twice with a water sample, and air exchange with the atmosphere was excluded by sealing the bottle lid with an elastic Parafilm film. Also, when filling the water sample, air bubbles were prevented from entering the vial. A total of 7 ice samples were taken from the ice. Table 2. Sampling from the ice layer, Buluus, Ulakhan-Taryn, Central Yakutia, July 2023 | № | Field number | Depth, cm | Type of sample | | 1 | Ultar-23-1/1 | 0 | Surface waters | | 2 | Ultar-23-4/1 | 0 |
Groundwater | | 3 | Ultar-23-5/1 | 0-10 | Ice | | 4 | Ultar-23-5/2 | 10-20 | Ice | | 5 | Ultar-23-5/3 | 20-30 | Ice | | 6 | Ultar-23-5/4 | 30-40 | Ice | | 7 | Ultar-23-5/5 | 40-50 | Ice | | 8 |
Ultar-23-5/6 | 50-60 | Ice | | 9 | Ultar-23-5/7 | 60-70 | Ice | | 10 | Ultar-23-6/1 | 0 | Groundwater | Laboratory isotope studies of glacial ice Measurements of the isotopic composition of oxygen and hydrogen of ice were performed using a Picarro L 2130-i laser infrared spectrometer at the X-ray Diffraction Research Methods Resource Center at the Scientific Park of St. Petersburg State University. The following international standards are used: V-SMOW-2, GISP, SLAP, USGS-45 and USGS-46. The error of the definitions was: for ?18 O – ± 0.02 %, for ?2 H – ± 0.3 %. The values of the deuterium excess (d exc) were calculated using the formula of V.Dansgor[37]: d exc = ? 2 H – 8? 18 O. Results The isotopic composition of the glacial ice. The isotopic composition of the glacial ice of the Buluus ice varies little: the values of ?18 O vary from -20.2 to -21.9%, the values of ?2 H vary from -159.5 to -173.7% (Table 3). The ice ice as a whole is isotopically slightly more “heavy” compared to the surface waters of the Ulakhan-Taryn stream, the values of ?18 O They are -22.18%, and the value of ?2 H is -175.1%. Groundwater is isotopically close to the waters of the stream, they are also isotopically more “light” compared to glacial ice, in them the values of ?18 O vary from -22.17 to -22.25, the values of ?2 H vary from -173.7 to -175.1. Table 3. Isotopic composition of ice, Buluus, Ulakhan-Taryn, Central Yakutia, July 2023 | Field number |
Depth, cm | Type of sample | ? 18 O, ‰ | ?2H, ‰ | | Ultar-23-1/1 | 0 | Surface waters | –22,18 | –175,1 | | Ultar-23-4/1 | 0 | Groundwater | –22,17 | –173,6 | | Ultar-23-5/1 | 0-10 | Ice | –20,4 | –161,1 | | Ultar-23-5/2 |
10-20 | Ice | –20,1 | –159,5 | | Ultar-23-5/3 | 20-30 | Ice | –21,2 | –166,6 | | Ultar-23-5/4 | 30-40 | Ice | –22,2 | –173,7 | | Ultar-23-5/5 | 40-50 | Ice | –20,8 | –164,9 |
| Ultar-23-5/6 | 50-60 | Ice | –20,2 | –160,9 | | Ultar-23-5/7 | 60-70 | Ice | –21,9 | –170,7 | | Ultar-23-6/1 | 0 | Groundwater | –22,25 | –173,7 | Discussion
The study of ice. The study of glaciers was started by A.F.Middendorf, G.L.Maydel, K.Ditmar, S.A.Podyakonov in the middle of the XIX century. V.R.Alekseev, A.P.Gorbunov, M.I.Sumgin, N.I.Tolstikhin, V.G. Petrov, A.M. Chekotillo, D.Lascelles, F.Michael, K.Yoshikawa, and others made a great contribution to the development of ice science. The factors of ice formation have been established: natural gravitational unloading of groundwater basins; freezing of aquifer systems with the formation of cryogenic pressure; application of external load on the ice cover; fluctuations in the flow rates of subglacial water flows; melting of snow and ice in conditions of frequent air passage through 0oC; water flows to the cooled shore as a result of periodic and non-periodic tides; discharge of industrial and domestic waters in the cold season. According to approximate data, the total area of ice in Siberia is about 130,000 km2.[1,2] The size of ice varies from very small (area up to 103 m2, volume up to 103 m3) to gigantic (area more than 107 m2 , volume more than 2,107 m3). According to the time of existence, annual (completely thawing in summer), flying (existing until the end of summer), perennial (existing for several years), ice are distinguished. , volume more than 2,107 m3). According to the time of existence, annual (completely thawing in summer), flying (existing until the end of summer), perennial (existing for several years), ice are distinguished. The main attention is usually attracted by large ice fields formed due to the outpouring and subsequent freezing of groundwater. As a rule, such ice masses are "strung" on riverbeds, have a rounded configuration and extend over the entire width of the valley floor, separating from each other by considerable distances. A relatively small number of papers have been devoted to the study of other genetic types of ice (river, snowmelt, lake waters). As a result, it was believed that on the rivers of Siberia and the Far East, although ice is large, it occurs locally, i.e. it does not form continuous ice sheets along the length of watercourses. For example, in the Ice Catalogs of the BAM zone, the characteristics of more than 4,000 groundwater glaciers recorded by special aerial photography on the territory of 260000 km2 are reflected. All of them demonstrate the discrete nature of the distribution of ice masses. Meanwhile, observations on Siberian rivers[3] have shown that glaciers are more widespread and that their origin is heterogeneous. In the harsh climatic conditions of the Asian part of Russia, especially east of the Yenisei, in the permafrost zone with its exceptionally poor soil nutrition, rivers freeze to the bottom. In the riverbeds of Eastern Siberia and other regions, a hanging ice cover, the so-called “dry ice”, is often observed in winter; it is formed when the water level decreases due to depletion of the river's supply and, mainly, a decrease in groundwater reserves. Due to the constriction of the riverbed during ice formation, sometimes there is an outlet of water through cracks on the ice, as a result of which ice of large or smaller sizes is formed. The glaciers observed on the rivers of the European part of Russia are small and in size most often do not exceed 1 km2 in area. In the Asian part of Russia, especially in Eastern Siberia, giant glaciers, called "taryns" in Yakut, are widespread, the area of which sometimes reaches several tens of square kilometers, and the volume is estimated in tens and hundreds of millions of cubic meters. At the same time, not only the riverbed is filled with ice, but often the entire valley floor. The area of the Moma ice in the valley of the Moma River (tributary of the Indigirka) reaches 160-180 km 2, and the volume is 500-600 million m3, the Kyr ice (valley of the Kyra river) has an area of up to 28 km 2, and the volume is up to 38 million m3. Such powerful ice water storages, melting in summer, have a significant impact on interstellar feeding of rivers. With an ice volume of 38 million m3, the river will receive additional nutrition on average 4-5 m3/sec due to ice melting in 3-4 summer months; Momskaya ice gives 16-20 m3/sec. On the rivers of Eastern Siberia, along with giant glaciers, there are non-freezing areas and polynyas (in Yakut, aimes). On the Omolon River, for example, in the winter of 1928/29, 20-30% of the total surface of the riverbed was not covered with ice; the same phenomenon was noted on the Korkodon River and other watercourses. Within the mountain belt of the Eastern Sayan and Khamar-Daban, there are large glacial fields of river, groundwater and mixed types, the almost annual formation of which is due to the sharply continental harsh climate, the long duration of the winter season, the presence of permafrost rocks, sufficiently high groundwater reserves and river freezing. Glaciers of river waters are most often found in riverbeds crossing intermountain depressions and plains. Here they follow each other almost without interruptions, forming wide ice bands up to 70 km long and up to 1.5 m thick. Their formation usually stops in November-December. Glaciers of groundwater (groundwater and key) are most often confined to the disintegration of mountains and gorges and have a capacity of 3-4 m. Sometimes there are hanging ice, as well as buried under a thin layer of deluvium.[1] Ice often moves rather large fragments and even boulders over a long distance along the river (Fig. 7). 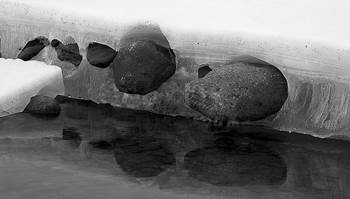
Fig. 7. Large boulders frozen into the lower part of the river ice on the Moma river. Photo by S.Karpukhin
The results of field studies on the Oude River, in the area where the river flows into it.Nerkhi, made it possible to describe the mechanism of formation of river ice. The most widespread in the studied region were ice formed during the freezing of most small rivers up to 30-50 km long and on some watercourses up to 100-150 km long. The main reason for the formation of such ice is the occurrence of additional pressure due to a decrease in the flow capacity of the riverbed with an increase in ice or an increase in the water content of the stream. The mechanism of outpouring of waters forming pressure ice is similar to the mechanism of formation of river water ice. The differences consist only in the peculiarities of deformation of ice and water-saturated frozen soil, which, having sufficient rigidity, deforms slightly, which leads to an increase in pressure along the length of the subsurface stream when it freezes. This pressure spreads to the unfrozen areas of the rivers, where the outpouring of icy waters occurs. Glacial processes develop most intensively in the char belt of the Eastern Sayan mountain ranges. Most of the ice massifs, their total area and volume are confined to the abs. heights of 1200-1600 m. The maximum values of the ice thickness are also recorded here. V.R.Alekseev, O.A.Kovalchuk, V.V.Kravchenko and employees of the Glaciology Laboratory of the Institute of Geography of the Siberian Branch of the Russian Academy of Sciences performed long-term regime observations in the Sayans on watercourses of various orders: the Uda River basin, the Egega and Eden rivers (at the Eden, Shamanka and Blue Stone landfills). Stationary observations made it possible to investigate the main patterns of ice accumulation and melting in the mountainous region of the Eastern Sayan, determine the share of ice nutrition in groundwater and river runoff, and assess the importance of glacial processes in the redistribution of natural waters. The growth of ice here begins in late October - early November. The most intensive growth of ice is associated with the conditions of their nutrition and occurs in the second half of winter. The average volume of groundwater ice gradually increases with increasing elevation, reaching its maximum at the upper boundary of the forest. The largest area of ice fields is also recorded here. River ice is limited in the char and sub-Char belts, due to the presence of a powerful snow cover, active but short-term ice formation in the coastal parts of the valley.[2] The process of ice breaking begins in mid–April and ends in July - August. The melting intensity is higher in the initial period. The main factors of ice destruction are the amount of heat coming to the surface of the ice, the mechanical effect of water flows and precipitation. The annual formation of ice provides a stepwise longitudinal profile of the riverbed, leads to the leveling of the ice bed and the expansion of the valley floor. Because of this, there is a displacement of ice clearings upstream or downstream of the river. Due to the development of the processes of ice denudation, the destruction of coastal ledges and their retreat occurs, as a result of which the size of the ice glade gradually increases (the rate of retreat is on average 20-30 cm per year, in some cases up to 100 cm or more). Ice and ice processes are accompanied by a series of dangerous natural phenomena - heaving of soils, suffusion, solifluction, thermokarst.[1] Among the phenomena associated with ice, heaving mounds and hydrolaccoliths are noted. Of great interest were the cavities in the ice cover of glacial rivers formed as a result of thin-layer freezing of water along the sides of the valley and the convergence of the powerful ice masses formed at the same time. Stationary observations of ice formation processes in the Baikal region were carried out in 2004-2006.. employees of the Irkutsk, Chita and Buryat hydrometeorological services at two observation sites: - Kultuk site (near the village of Kultuk, Irkutsk region) in 7 foci: Sinyukha Pad, Tigunchikha River, Lesnaya Pad, 1-Vorotnaya Pad, 2-Vorotnaya Pad, Shkolnaya str., Medlyanka-1, Medlyanka. In 2006, the formation of ice in this area was mainly due to man-made disturbance of surface and underground runoff. In winter, due to the fact that a highway was rolled along the riverbed of the Medlyanka River, the riverbed froze with the formation of ice, which flooded more than 10 household plots and threatened the school building on Kirova Street. The formation of the second ice is associated with a violation of natural runoff during construction work on the railway. Ice formation in the Tiganchikha River valley was associated with a weak bridge capacity on the federal highway. In 2006, ice flooded several residential buildings, a store, outbuildings and the territory adjacent to the carpool. According to the results of the survey of the route of the East Siberian Railway, the highest degree of ice damage was detected on the stretch of the village. Vydrino is the village of Timlyui, where ice is found on average every 10 km of the highway. Railway bridge crossings are blocked by ice by 40-90%; protective measures are carried out by railway services and are reduced to filling anti-ice dams, loosening and shedding ice under bridges, cutting trenches and ditches to drain water. These measures are ineffective and are used as temporary measures to reduce the activity of the impact of the process on the railway, but require considerable labor and material costs annually. On the stretch of the village of Timlyui – Ulan-Ude in 2006, ice was observed along the beds of small rivers Timlyuika, Transverse, Chernushka, Mostovka, and ruch. Oshurkovo. In general, as a result of the conducted survey of the VSZHD route, it can be noted that ice is confined to the beds of small mountain rivers, where the areas of ice bodies range from 0.1 to 2 km2. In most cases, the occurrence of ice is provoked by the creation of artificial barriers to river flow during the construction of embankments of railways and highways, regulation of runoff for reclamation purposes, etc. V.R. Alekseev[1,2] showed that in order to study ice phenomena, it is possible to obtain operational data on the state of ice through short-term ground, aerial and airborne observations, as well as aerial and space surveys, using characteristic features and properties of cryogenic natural complexes. Based on the materials of long-term studies of glaciers and glacial processes at special glaciological polygons in Transbaikalia and Eastern Sayan, an atlas of landscape indicators has been prepared, including their characteristics, typical types of glaciers and glacial landscapes.
According to the observations of N.A.Pavlova and V.V.Shepelev[31] in the upper reaches of the Buluus tract, the shedding and flattening of the slopes with subsequent forestation of the bottom of the stream valley contributed to the formation of permafrost rocks. The process of gradual freezing of the marginal part of the talik is evidenced by the migration of groundwater outlets from the head of the decay to its middle part. The deterioration of water exchange in the upper reaches of the tract is also facilitated by the ice formation regime. Detailed observations of the growth and melting of ice in the Buluus tract were carried out by employees of the Institute of Permafrost Science SB RAS in the 1960s.[31] In the last decade, only one-time measurements of ice thickness were carried out in December and March. Ice formation in the decay begins in its upper reaches due to the freezing of dispersed low-flow sources. Ice does not form on the rest of the area until the second decade of December. Along the relatively deeply embedded streambed, water from high-flow springs flows into the old lake, located on the low floodplain terrace of the Lena River. In January–February, after the freezing of the main streambed, an increased growth of ice begins. The rate of increase in its capacity and volume in the middle and lower parts of the disintegration significantly exceeds the rate of ice formation in its upper reaches. Therefore, the maximum thickness of the ice by the end of winter reaches 4-6 m in the area of springs, and in the head part of the decay is less than 0.5 m. The ice has a warming effect on the underlying soils. Accordingly, its thermal effect is minimal in the upper reaches of the Buluus river, where the lowest ice capacity is noted and groundwater discharge stops in the first half of winter.[31]
The backup of the forming ice and the freezing of rocks in the area of dispersed low-flow sources contribute to the separation of the aquifer into separate melt “pockets”, in which, according to V.V.Shepelev[31], the water composition is transformed due to cryogenic metamorphosis. As a result of long-term studies of groundwater sources Ulakhan-Taryn by L. A. Gagarin and colleagues[13], it was found that the area of groundwater supply of the inter-permafrost aquifer is partially confined to the alasny and interalasny types of terrain and mainly to the sandy ridge. In the first two types of terrain, the hydraulic connection of surface waters with an inter-permafrost aquifer is carried out through a network of water-absorbing atmospheric taliks. In the sandy-ridge type of terrain, infiltration feeding of the inter-permafrost aquifer occurs both through subaqueous (atmospheric) and subaerial suprafrost talics. The groundwater transit area is also located here. Within its limits, the inter-permafrost aquifer has been repeatedly uncovered by exploration wells at depths of 24-36 m under the MMP thickness. The capacity of the talik is not sustained and varies from 8 to 25 and more m. The presence of an overlapping and underlying cryogenic water barrier determines the pressure mode of filtration of inter-permafrost waters, the level of which is set in wells 24-34 m above the roof of the aquifer. Near the groundwater discharge zone, the depth of the inter-permafrost aquifer is 16-27 m, its capacity increases to 32-56 m, and the pressure of inter-permafrost waters does not exceed 7-12 m. In winter, almost dry sands of the seasonally shallow layer (weight humidity no more than 5%) in the sandy ridge type of terrain provide low thermal conductivity of frozen rocks, and in the warm season, rapid infiltration of thawed snow waters and precipitation, accompanied by an increase in the thermal conductivity of the sands, contributes to their deep thawing - up to 4-5 m. The permafrost aquifer is a major source of heat, and also makes a significant contribution to the formation of the temperature regime of rocks. This is evidenced by the high values of the average annual temperature of the MMP (up to -0.2 °C), which overlap the permafrost aquifer, and a reduction in the thickness of the annual heat turnover layer up to its coincidence with the thickness of the seasonal rock thawing layer.[13] K.Yoshikawa and co-authors [45] established that the source of winter runoff in the eastern part of the Brooks Range in Alaska is mainly spring waters of intra- and sub-frozen aquifers. A comparison of modern and historical images of glaciers showed that although the size of the glaciers varies from year to year, the overall location remains almost constant. The study of ice activity is of great practical importance in assessing ice hazards on winter roads, in areas of design and construction of bridges, ice crossings, pipelines, in forecasting spring floods and ice jams, in general assessment of the patency of the territory, etc. Variations in the isotopic composition of ice As already mentioned, the isotopic composition of the Buluus ice (Ulakhan-Taryn) varies little: the values of ?18 O vary from -20.2 to -21.9%, the values of ?2 H vary from -159.5 to -173.7%. Recall that the isotopic composition of the glacial ice on the Vilyu River also varies in a very narrow range [10]: a) ice 1 – the values of ?18 O vary from -19.3 to -20.9%, the values of ?2 H vary from -156.5 to -162.9%; b) ice 2 – the values of ?18 O vary from -19.7 to -22.4%, the values of ?2 H vary from -153.2 to -173.1 %; c) ice 3 – the values of ?18 O varies from -19.8 to -22.7%, the values of ?2H vary from -162.9 to -181.3%. Note that the studied fragment of the Buluus ice (Ulakhan-Taryn) is only the lower part of the ice. As already mentioned, the ice reaches a thickness of 3 m at the end of winter; at the time of the study (early July), the ice thickness was 115 cm (see Fig. 5), therefore, the studied fragment is about half of the original ice. At the same time, only the upper 70 cm of the remaining part of the ice were selected for isotopic determinations, the lower fragment with a thickness of 45 cm was not tested. As a result, the isotopic distribution can be considered only in a certain fragment of ice (the bottom fragment has not been selected, the upper part has melted).
We assumed that the formation of ice occurred, most likely, during the freezing of groundwater in a closed system (similar to the one cited by D.Lascelles[39]), the build-up of ice went from bottom to top, with layered freezing of portions of water, and calculated the model distribution of ?18 O values in the layer-by-layer ice according to the Rayleigh formula. The freezing of water is accompanied by isotopic fractionation, as a result, the first 60-65% of the ice formed is isotopically heavier than water by 1.8-2.8% according to the values of ?18 O.[39,41] At the same time, the isotopic composition of oxygen is facilitated by 1.8-2.8% of the remaining water under equilibrium conditions; the higher the freezing rate, the lower the fractionation coefficient and the smaller the difference in the isotopic composition between water and ice. 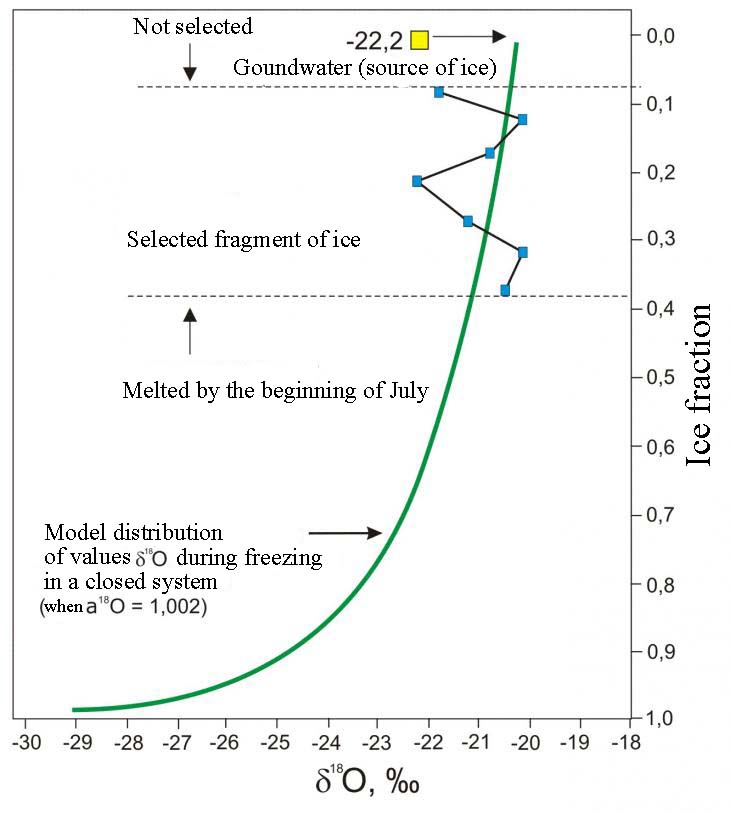 Fig. 8. Distribution of ?18 O values in the Buluus ice fragment and the theoretical distribution of ?18 O values in ice calculated by Rayleigh's formula during successive freezing of the initial volume of spilled water (green line) The lowest layer of ice (presumably 20 cm) is most likely the ice of the Buluus River water, the layers located above are most likely formed by the outpouring to the surface and freezing of groundwater. In the studied fragment of ice, we most likely tested ice of successively formed fractions (layers) from 0.09 to 0.38 (Table 4, Fig. 8). Table 4. Distribution of isotopic values (?18 O, ?2 H, d exc) in the ice fractions of the studied ice fragment | Depth from the surface, cm | Estimated ice fraction | ? 18 O, ‰ | ?2H, ‰ | dexc,‰ | | 0-10 | 0,38 | ?20,4 | ?161,1 | 2,1 | | 10-20 | 0,33 | ?20,1 | ?159,5 | 1,3 | | 20-30 | 0,28 | ?21,2 | ?166,6 | 3,0 | | 30-40 | 0,23 | ?22,2 | ?173,7 | 3,9 | | 40-50 | 0,18 | ?20,8 | ?164,9 | 1,5 | | 50-60 | 0,13 | ?20,2 | ?160,9 | 0,7 | | 60-70 | 0,09 | ?21,9 | ?170,7 | 4,5 | The first fractions of ice (if we consider groundwater with a value of ?18 O=-22.2% as the source of water, see Table. 3) theoretically, they could be characterized by a value of ?18 O -20.2% if the fractionation coefficient ?18 O = 1.002 (some average value at an average rate of freezing of water). The following portions of ice, freezing from bottom to top, should be characterized by a gradual decrease in the values of the isotopic composition, since the remaining water is also gradually isotopically depleted. The ideal (model) distribution of the isotopic composition of ice during freezing of the volume of water (with a value of ?18 O =-22.2%) has the form of a smooth curve with values for the formed ice from -20.2 to -29% (see Fig. 8).
The actual distribution of the isotopic composition of the ice fragment differs from the model one in its sawtooth shape (see Fig. 8), although in general, the tendency to decrease the isotopic composition as the ice increases (from an ice fraction of 0.09 to 0.38) can be traced. Such a sawtooth character of the isotope curve can be explained by the fact that isotopically light snow periodically falls on the surface of the ice and groundwater, mixing with snow, forms layers of ice with a lower isotopic composition (negative peaks on the isotope curve). Lower values of ?18 O correspond to lower values of ?2 H and higher values of d exc (Fig. 9, a-c), which may correspond to winter precipitation (winter snow, as a rule, is characterized by higher values of d exc). It can also be assumed that several aquifers were frozen, and the freezing of each of them was accompanied by the pouring of water onto the surface with the formation of the first layers with a heavier isotopic composition (positive peaks on the isotope curve). 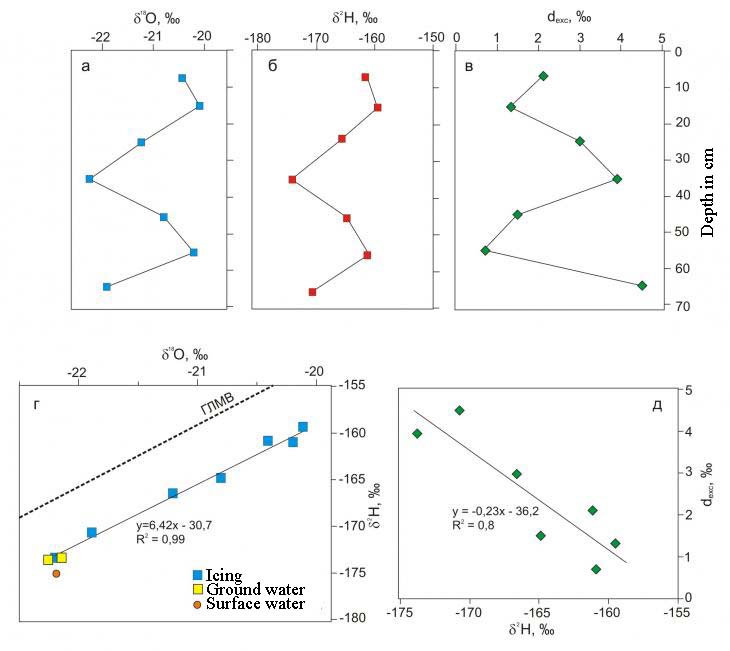
Fig. 9. The distribution of isotopic composition values (a – ?18 O, b – ?2 N, c – d exc) vertically in the Buluus ice, the ratio ?2 H-?18 O in the ice of the ice and groundwater and surface waters (d) and d exc-?2 N (d) in the ice In any case, the values of the isotopic composition in the exposed ice fragment do not contradict the theory of freezing of liquid water under equilibrium conditions, since the line of the ratio ? 2 H-? 18 O has a slope of 6.4 (Fig. 9, d), which is in the range 6.2-7.3 for theoretically calculated slopes of the ratios ? 2 H-? 18 O for ideal Rayleigh fractionation during the transition of water to ice; also, the ratio d exc-? 2 H has a negative slope value = -0.23 (Fig. 9, e), which may indicate freezing of liquid water (not precipitation, for which there is no correlation between d exc-?D). This value is close to the slope d exc-? 2 N ? -0.25 theoretically calculated by D. Lassel[39] for ice formed under equilibrium freezing conditions. Earlier, the authors conducted a study of the isotopic composition of 3 glaciers in the valley of the Vilyu River.[10] A comparison of the ratio of the values ? 2 H and ? 18 O of the Buluus ice floes (Fig. 10, a) and three glaciers on the Vilyui River (Fig. 10, b) showed the similarity of the co-isotope equations, the ratio coefficients are 6.7 for the Buluus ice and 6.0, 5.3 and 5.1 for the three glaciers on the Vilyu River. This demonstrates that the mechanism of ice formation is similar. It can also be noted that the isotopic composition of the glacial ice on the Vilyui River also varies in a very narrow range: the values of ?18 O vary from 1.6 to 1.9%, the values of ?2 H – from 6.4 to 19.9%. However, the values of the isotopic composition of groundwater sources for Vilyui glaciers are more contrasting: for two Vilyui glaciers (Nos. 2 and 3), the isotopic composition of the source water is located within the range of values for ice, for Vilyui glaciers No. 1, the source water is more isotopically light (as in the case of Buluus ice and its source). Such a difference may indicate that glaciers 2 and 3 were formed rather under conditions of a more closed system, when the isotopic composition of the ice first becomes heavier, and then its gradual relief. For ice 1, such conditions were not fully realized, since the weighting of the isotopic composition of ice from bottom to top was noted. 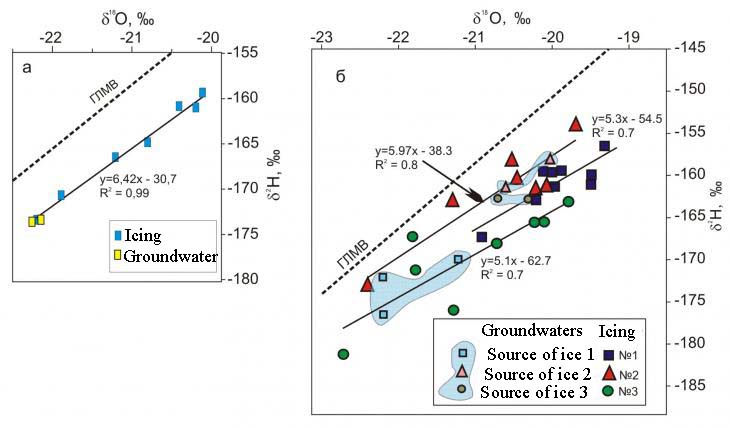 Fig. 10. Diagrams of the ratio of values ? 2 H and ? 18 On the Buluus ice (a) and three glaciers on the Vilyui River (b)
A comparison of the ratio of the values ? 2 H and ? 18 O of the Buluus ice floes (Fig.10, a) and three glaciers on the Vilyu River (Fig. 10, b) showed the similarity of the co-isotope equations, the ratio coefficients are 6.7 for the Buluus ice and 6.0, 5.3 and 5.1 for the three glaciers on the Vilyu River. This demonstrates that the mechanism of ice formation is similar. When freezing in a closed ice system, isotopic fractionation can occur, with a layered process of ice growth from bottom to top. Freezing of water can be accompanied by the formation of ice, which is 1.8-2.8% heavier than the source water. At the same time, the isotopic composition of oxygen is facilitated by 1.8-2.8% of the remaining water under equilibrium conditions, faster freezing usually significantly reduces fractionation;The lower layers of the ice were formed from groundwater ? the value of ?18 O of ice in the bottom part of the Buluus ice at a depth of 0.4-0.7 m is below -22%. In the ice layers above, the value of ?18 O ranges from -21.2 to -22.2, which probably reflects some participation of isotopically lighter snow. Conclusions The study of the isotopic composition of the glacial ice made it possible to establish that: - The studied fragment of the Ulakhan-Taryn ice is the lower part of the ice. As already mentioned, the ice reaches a capacity of 3 m at the end of winter, at the time of the study (early July), the ice thickness was 115 cm;
- The isotopic composition of the Buluus ice varies little: the values of ?18 O vary from -20.2 to -21.9, the values of ?2 H vary from -159.5 to -173.7. The glacial ice as a whole is isotopically slightly more “heavy” compared to the surface waters of the Ulakhan-Taryn stream, the values of ?18 O are -22.18%, and the value of ?2 H is -175.1%. Groundwater is isotopically close to the waters of the stream, they are also isotopically more “light” compared to glacial ice, in them the values of ?18 O vary from -22.17 to -22.25, the values of ?2 H vary from -173.7 to -175.1;
- When ice freezes in a closed system, isotopic fractionation can occur, with a layered process of ice growth from bottom to top. Freezing of water can be accompanied by the formation of ice, which is 1.8-2.8% heavier than the source water. At the same time, it is accompanied by a reduction in the isotopic composition of oxygen by 1.8-2.8% of the remaining water under equilibrium conditions, usually faster freezing significantly reduces fractionation;
- The lower layers of the ice were formed from groundwater ? the value of ?18 O of ice in the bottom part of the Buluus ice at a depth of 0.4-0.7 m is below -22%. In the ice layers above, the value of ?18 O ranges from -21.2 to -22.2, which probably reflects some participation of isotopically lighter snow.
References
1. Alekseev, V. R. (1987). Aufeis. Ed. V. V. Vorobyov. Novosibirsk: Nauka.
2. Alekseev, V. R. (2005). Landscape indication of ice phenomena. Institute of Geography SB RAS; Resp. ed. V. A. Snytko. Novosibirsk: Nauka.
3. Alekseev, V.R., & Savko, N.F. (1975). Theory of ice processes (engineering and geographical aspects). Moscow: Nauka.
4. Alekseev, V.R. (2016). Long-term variability of spring ice-taryns. Ice and Snow, 56(1) 73–92. doi:10.15356/2076-6734-2016-1-73-92
5. Anisimova, N.P. (1969). Some features of the formation of the chemical composition of lake and ice in Central Yakutia. Naleds of Siberia. Pp. 183–190. Moscow: Nauka.
6. Atlas of the Yakut Autonomous Soviet Socialist Republic. (1981). Ed. T.D. Sivtsev et al. Moscow: GUGK USSR.
7. Baishev, N.E., Shepelev, V.V., & Gagarin, L.A. (2021). On the patterns of ice spread on the federal highway A-360 “Lena” according to multispectral satellite images. Natural Resources of the Arctic and Subarctic, 1, 60–69. doi:10.31242/2618-9712-2021-26-1-6
8. Bogomolov, N.S., & Sklyarovskaya, A.N. (1969). About the explosions of hydrolaccoliths in the southern part of the Chita region. In the book: Naleds of Siberia. Pp. 127–130. Moscow: Nauka.
9. Boytsov, A.V. (2002). Conditions of formation and regime of groundwater of supra-permafrost and inter-permafrost flow in Central Yakutia. Abstract Ph.D. geol.-mineral. sci. Yakutsk: Institute of Permafrost Science named after. P.I. Melnikova SB RAS.
10. Vasil'chuk, Yu. K., Budantseva, N. A., Ginzburg, A.P., & Vasil'chuk, A.C. (2022). Stable oxygen and hydrogen isotope ratios of the aufeis of the Viluy River valley. Arctic and Antarctic, 1, 1–37. doi:10.7256/2453-8922.2022.1.37931
11. Eastern Siberia. Hydrography of the USSR. Ch. 23 (1954). Sokolov A.A.
12. Gagarin, L.A. (2013). Dynamics of thermosuffusion processes in the permafrost zone (on the example of Central Yakutia). Ph.D. geol.-mineral. sci.–Yakutsk: of Melnikov Permafrost Institute SB RAS.
13. Gagarin, L.A., Olenchenko, V.V., & Pavlova, N.A. (2023). On the reasons for the attenuation of thermosuffosion processes on the Bestyakhskaya terrace of the river. Lena in Central Yakutia. Geoecology. Engineering Geology. Hydrogeology. Geocryology, 5, 28–42. doi:10.31857/S0869780923040045
14. Gagarin, L.A., Bazhin, K.I., Olenchenko, V.V., Ogonerov, V.V., & Wu, Qingbai. (2019). Identification of areas of potential thermal suffosion decompaction of soils along the federal highway A-360 “Lena” in Central Yakutia. Earth's Cryosphere, 3(XXIII), 61–68. doi:10.21782/KZ1560-7496-2019-3(61-68)
15. Desyatkin, R.V. (2006). Soil formation in thermokarst basins–alas of the permafrost zone. Abstract of thesis doc. biol. sci. Ulan-Ude.
16. Desyatkin, R.V. (2021). Alas ecosystems are the basis for the development of cattle breeding in the harsh climatic conditions of Yakutia. Science and technology in Yakutia, 2(41), 13–18.
17. Zaitsev, A.A., Kirik, O.M., & Mikhailov V.S. (2008). Interaction of river ice with the river bed. Lena and its tributaries. Soil erosion and channel processes, 16, 242-262. Moscow: Moscow State University.
18. Kamaletdinov, V.A., & Minyuk, P.S. (1991). Structure and characteristics of sediments of the Bestyakh terrace of the middle Lena. Bull. commission according to study Quatern. period, 60, 68–78.
19. Chronicle of weather in Pokrovsk (Yakutia). Electronic database “Weather and climate”. Retrieved from http://www.pogodaiklimat.ru/history/24856.htm
20. Permafrost-landscape map of the Republic of Sakha (Yakutia). (2018). Ed. M.N. Zheleznyak. Yakutsk. Melnikov Permafrost Institute Studies SB RAS.
21. Murzin, A.Yu. (2006). Naledi of Yakutia. Science and technology in Yakutia, 2(11), 100–104.
22. Olenchenko, V.V., Gagarin, L.A., Khristoforov, I.I., Kolesnikov, A.B., & Efremov, V.S. (2017). The structure of the development site of thermosuffosion processes within the Bestyakh terrace of the Lena River according to geophysical data. Earth's Cryosphere, 5(XXI), 16–26. doi:10.21782/KZ1560-7496-2017-5
23. Palamarchuk, V.A., Lebedeva, L.S., Pavlova, N.A., Khairullin, R.R., & Baishev, N.E. (2023). Current state of groundwater springs of the Mahatta sand massif, Eastern Siberia. Earth's Cryosphere, 4(XXVII), 24–36. doi:10.15372/KZ20230403
24. Petrov, V.G. (1930). Naleds on the Amur-Yakutsk highway. Leningrad: Publishing House of the USSR Academy of Sciences.
25. Pravkin, S.A., Bolshiyanov, D.Yu., Pomortsev, O.A., Savelyeva, L.A., Molod’kov, A.N., Grigoriev M.N., Arslanov Kh.A. (2018). Relief, structure and age of Quaternary deposits of the river valley. Lena in the Yakut bend. Vestn. St. Petersburg State University. Geosciences, 63(2). 209–228. Retrieved from https://doi.org/10.21638/11701/spbu07.2018.206
26. Surface water resources of the USSR: Hydrological knowledge. Vol. 17. (1964). Lensko-Indigirsky district. Vol. 4. River basin Lena from the mouth of the Aldan River to the mouth of the Vilyui River and the river basin Vilyui. Ed. A.S. Sharoglazov-Leningrad: Gidrometeoizdat.
27. Savvinov, D.D., Prokopyev, N.P., Fedorov, V.V., Gorokhov, A.N., Dmitriev, A.I., Pesterev, A.P., Gavrilyeva, L.D., Poiseeva, S.I., Arkhipov, V.V., Averensky, A.I., Larionov, A.G., Bosikov, N.P., Kilibaeva, O.N., & Gabysheva, P.E. (2002). Ecology of alass ecosystems. Yakutsk.
28. Spektor, V.V., Spektor, V.B., Boeskorov, G.G., Belolyubsky, I.N., & Bakulina, N.T. (2017). Periglacial alluvium of the Central Yakut Plain according to the study of the reference outcrop Peschanaya Gora. Vestn. ZabSU, 23(5), 45–59. doi:10.21209/2227924520172354559
29. Chevychelov, A.P. (2020). Permafrost soils of Central Yakutia: geography, genesis and diversity. Proceedings of the VII International Scientific Conference dedicated to the 90th anniversary of the Department of Soil Science and Soil Ecology of TSU "Reflection of bio-, geo-, anthropospheric interactions in soils and soil cover" (Tomsk, 14–19 September 2020). TSU Publishing House (pp. 98–101).
30. Chevychelov, A.P., Alekseev, A.A., & Kuznetsova, L.I. (2021). Magnetic susceptibility of frozen soils in the forest catena of Central Yakutia. Siberian Forest Journal, 2, 32–42. doi:10.15372/SJFS20210203
31. Shepelev, V.V. (1975). On the issue of classification of aufeis. Issues of hydrogeology of the permafrost zone (pp. 107–118). Yakutsk.
32. Brombierstäudl D., Schmidt S., & Nüsser M. (2023). Spatial and temporal dynamics of aufeis in the Tso Moriri basin, eastern Ladakh, India. Permafrost and Periglacial Processes, 34(1), 81–93. doi:10.1002/ppp.2173
33. Chalov, S., Prokopeva, K., Magritsky, D., Grigoriev, V., Fingert, E., Habel, M., Juhls, B., Morgenstern, A., Overduin, P.P., & Kasimov, N. (2023). Climate change impacts on streamflow, sediment load and carbon fluxes in the Lena river delta. Ecological Indicators. Vol. 157. 111252. Pp. 1–14. doi:10.1016/j.ecolind.2023.111252
34. Chesnokova A., Baraër M., & Bouchard É. (2020). Proglacial icings as records of winter hydrological processes. The Cryosphere, 14, 4145–4164. doi:10.5194/tc-14-4145-2020
35. Chevychelov, A.P., Skrybykina, V.P., & Vasil’eva, T.I. (2009). Geographic and genetic specificity of permafrost-affected soils in central Yakutia. Eurasian Soil Science, 42(6), 600–608. doi:10.1134/S1064229309060039
36. Crites H., Steve V. Kokelj S.V., & Lacelle D. (2020). Icings and groundwater conditions in permafrost catchments of northwestern Canada. Scientific Reports, 10, 3283. doi:10.1038/s41598-020-60322-w
37. Dansgaard, W. (1964). Stable isotopes in precipitation. Tellus, 16(4), 436–468. doi:10.1111/j.2153-3490.1964.tb00181.x
38. Ensom T., Makarieva O., Morse P., Kane D., Alekseev V., & Marsh P. (2020). The distribution and dynamics of aufeis in permafrost regions. Permafrost and Periglacial Processes, 3, 383–395. doi:10.1002/ppp.2051
39. Lacelle, D. (2011). On the δ18O, δD and d-excess relations in meteoric precipitation and during equilibrium freezing: theoretical approach and field examples. Permafrost and Periglacial Processes, 22(1), 13–25.
40. Lainis A., Neupauer R.M., Koch J.C., Gooseff M. (2024). Seasonal and decadal subsurface thaw dynamics of an Aufeis feature investigated through numerical simulations. Hydrological Processes, 38(3), e15106. doi:10.1002/hyp.15106
41. Michel, F.A. (2011). Isotope characterisation of ground ice in northern Canada. Permafrost and Periglacial Processes, 22(1), 3–12.
42. MacDonald A. M., BlackA. R., Dochartaigh B. É. Ó , Everest J. , Darling W. G., Flett V., D. & Peach W. (2016). Using stable isotopes and continuous meltwater river monitoring to investigate the hydrology of a rapidly retreating Icelandic outlet glacier. Annals of Glaciology, 57(72), 151-158. doi:10.1017/aog.2016.22
43. Olenchenko V., Zemlianskova A., Makarieva O., & Potapov V. (2023). Geocryological Structure of a Giant Spring Aufeis Glade at the Anmangynda River (Northeastern Russia). Geosciences, 13, 328. doi:10.3390/geosciences13110328
44. Wohl E., & Scamardo J. E. (2022). Aufeis as a major forcing mechanism for channel avulsion and implications of warming climate. Geophysical Research Letters, 49, e2022GL100246. doi:10.1029/2022GL100246
45. Yoshikawa, K., Hinzman L. D., & Kane D. L. (2007). Spring and aufeis (icing) hydrology in Brooks Range, Alaska. J. Geophys. Res., 112, G04S43. doi:10.1029/2006JG000294
Peer Review
Peer reviewers' evaluations remain confidential and are not disclosed to the public. Only external reviews, authorized for publication by the article's author(s), are made public. Typically, these final reviews are conducted after the manuscript's revision. Adhering to our double-blind review policy, the reviewer's identity is kept confidential.
The list of publisher reviewers can be found here.
The subject of the study, according to the author, is the results of studying the morphology of the ice, the conditions of its occurrence and the distribution of stable oxygen and hydrogen isotopes in its lower part in the area of the southern border of the Bestyakh terrace on the right bank of the Lena River within the territory of two key sites: Ulakhan-Taryn creek and Buluus ice. The methodology of the study is indicated in the article as an analysis of the measurement parameters of samples obtained as a result of field research. The ice studied at the key site was selected from a vertical outcrop exposed as a result of natural lateral thawing of the ice with a 5.1 cm diameter steel crown driven by a Bosch electric drill. In laboratory conditions, measurements of the isotopic composition of oxygen and hydrogen of ice were performed using a Picarro L 2130-i laser infrared spectrometer at the X-ray Diffraction Research Methods Resource Center at the Scientific Park of St. Petersburg State University. The following international standards are used: V-SMOW-2, GISP, SLAP, USGS-45 and USGS-46. From the analysis of the article, it can be concluded that the authors of the article used the method of analyzing the data obtained, their generalization and plotting the distribution of isotopes in ice, as well as statistical research methods to identify the correlation coefficient, the vertical distribution of isotope composition values. The relevance of the topic raised is unconditional and consists in the fact that ice is one of the most dangerous natural phenomena. The negative impact of ice is determined by the unexpected flooding of the territory and subsequent freezing of water, the formation of ice barriers, icing of underground structures and communications (mines, tunnels, tunnels, culverts and sewer wells), as well as icing of roads and railways, coastal hydraulic structures, etc. Obtaining information about their distribution is an important component of the climatic and economic characteristics of cold regions, since snow is important for ecological and climatic systems. In this regard, it is necessary to register the actual characteristics in time and space, i.e. monitoring the snow supply regime in particular and the hydrological regime in general, depending on the conditions of formation, deposition and melting. This is an important aspect of understanding the geoecological mechanism of hydrological processes. The scientific novelty lies in the attempt of the author of the article, based on the research conducted, isotopic fractionation can occur during the freezing of ice in a closed system, with a layered process of ice growth from bottom to top. The author notes that the actual values obtained in the freezing of water can be accompanied by the formation of ice, which is heavier than the source water, while it comes with a relief of the isotopic oxygen composition of the remaining water under equilibrium conditions, usually faster freezing significantly reduces fractionation. This is an important addition in developing an understanding of the dynamics of water resources. Style, structure, content the style of presentation of the results is quite scientific. The article is provided with rich illustrative material reflecting the measurement results. The article is illustrated with visualized forms of photographs, graphs and tables. The bibliography is very comprehensive for the formulation of the issue under consideration, but does not contain references to normative legal acts and methodological recommendations on statistical data analysis. The appeal to the opponents is presented in identifying the problem at the level of available information obtained by the author as a result of the analysis. Conclusions, the interest of the readership in the conclusions there are generalizations that made it possible to apply the results obtained. The target group of information consumers is not specified in the article.
Link to this article
You can simply select and copy link from below text field.
|
|