|
MAIN PAGE
> Back to contents
Finance and Management
Reference:
Manukian S.G., Kurbatskii A.N., Malyutina O.M.
The relationship between the level of expected volatility and multipliers in the US stock market
// Finance and Management.
2023. № 2.
P. 52-68.
DOI: 10.25136/2409-7802.2023.2.40510 EDN: UAGTPD URL: https://en.nbpublish.com/library_read_article.php?id=40510
The relationship between the level of expected volatility and multipliers in the US stock market
Manukian Stella Grishaevna
Manukyan S.G.
post-graduate student of the faculty of Econometrics and Mathematical Methods of Economics, Faculty of the Moscow School of Economics, Lomonosov Moscow State University
119234, Moscow, Leninskie Gory, Lomonosov Moscow State University, 1, p. 61

|
smanukyan98@mail.ru
|
|
 |
Kurbatskii Aleksei Nikolaevich
Doctor of Physics and Mathematics
Kurbatskii A.N, PhD, Head of the Department of Econometrics and
Mathematical methods of economics, Moscow School of Economics,
Lomonosov Moscow State University
119991, Russia, Moscow, Msu str., Leninskie Gory, 1, of. p.1
|
|
akurbatskiy@gmail.com
|
|
|
|
Malyutina Ol'ga Mikhailovna
Malyutina O.M., junior research fellow, Institute of Economics, Russian Academy
of Sciences, Moscow
117218, Russia, Moscow, Nakhimovsky Prospekt, 32
|
|
Malyutinaom@gmail.com
|
|
|
|
DOI: 10.25136/2409-7802.2023.2.40510
EDN: UAGTPD
Received:
17-04-2023
Published:
04-08-2023
Abstract:
The subject of the research of this article is to identify the relationship between financial multipliers and the expected volatility (implied volatility) of shares of companies in the software sector of the United States. The purpose of the work is to investigate and characterize the effects of expected volatility on the undervaluation or overvaluation of company shares. The object of this study are 38 largest companies in the software sector with a capitalization of more than $ 5 billion. Special attention is paid to the nonparametric Tail model, which allows us to identify and confirm the existence of a relationship between the level of expected volatility and the logarithm of the growth rate of the financial multiplier. The very novelty of the proposed article lies, firstly, in the fact that the analysis was carried out in the coronavirus era, which is timely and interesting, since the Covid-19 pandemic had a serious impact not only on the lives and health of citizens, but also on financial markets. Secondly, interest in this topic cannot weaken due to the constant development and modification of financial markets, which forces investors to develop new and new approaches to evaluating companies for profit. Identifying undervalued companies in the financial market is one of the key goals of analysts and investors, since timely finding companies whose fair value is currently undervalued can bring significantly more income than investing in companies whose stock value is fairly valued. The results achieved within the framework of the conducted research are of practical significance, since they allow us to rank the identified companies with the same level of undervaluation by the value of expected volatility and, thereby, choose the most attractive for investments.
Keywords:
undervalued, overvalued, financial multipliers, implied volatility, stocks, Software sector, historical volatility, nonparametric Tail model, Covid-19 pandemic, fair value
This article is automatically translated.
You can find original text of the article here.
Introduction[1] This work is a continuation of the relevant analysis of the US stock market, which was started in the article Kurbatsky A.N., Manukyan S.G. "The impact of the expected growth rates of a company's profit on its current valuation on the example of the stock market of the United States of America" [1], which discussed the use of appropriate multipliers to assess the fair value of companies in the sector software. The main result was the identification of the relationship between the business valuation error, that is, underestimation or overestimation, and the multiplier level and the impact of the COVID-19 pandemic, which became a "black swan" event for financial markets in January 2020, threatening global health systems and creating numerous problems for the financial system [2,3]. Therefore, it is important to understand what impact this crisis may have on the valuation of companies. Speaking about the valuation of a company, it must be remembered that it involves risks, namely, volatility in the markets, which is of great importance for everyone who works in financial markets, and where they think more about it, in terms of unpredictability and are considered synonymous with risk. Significant changes in the volatility of financial market returns can have significant negative consequences for risk-averse investors, so a more accurate assessment of volatility is crucial when making investment decisions. An analyst using the evaluation method assumes that a specific coefficient can be applied to different companies operating in the same business or industry. Therefore, the collection of statistical information as a research base was carried out in accordance with the basic principles of the evaluation method. Next, a descriptive analysis of the indicators was carried out, descriptive statistics of multipliers and growth rates were analyzed, and the laws of the distribution of values were tested. In addition, for a more fundamental analysis, an approach to constructing a nonparametric Tail regression was used. All this made it possible to identify the relationship between the natural logarithm of the EV/GP multiplier and the growth rate. Features of using multipliers Multiplier is a term that characterizes the valuation of shares by dividing the market or estimated value of an asset by a certain element of the financial statements. The multiplier approach is a method of comparative analysis aimed at evaluating similar companies using the same financial indicators [4, p.30]. Among a wide range of different multipliers that are used to evaluate a business, EV/GP (EV – enterprise value; GP – Gross Profit) is used in this article. The numerator of the analyzed multiplier contains an analytical indicator of the observed value of the business [5] or "the value of the company, taking into account all sources of its financing" [6, p.5] Therefore, within the framework of this work, it is assumed to begin building a pair regression model in which this multiplier will act as a regressor affecting the growth rate. The value and evaluation of volatility There is usually a wide range of reasons why volatility is one of the key characteristics of the financial market, for example, in the article by Kevin Daly "Financial volatility: Issues and measuring techniques" [7] it is noted that: · First, when asset prices fluctuate sharply with a time difference of just one day or less, it may be difficult for investors to accept that the explanation for these changes lies in information about fundamental economic factors. This could undermine confidence in capital markets and reduce capital inflows to stock markets. · Secondly, for individual firms, the volatility of the firm is an important factor in determining the probability of bankruptcy. The higher the volatility of this capital structure, the higher the probability of default [7]; · Third, volatility is an important factor in determining the spread of supply and demand. The higher the volatility of the stock, the greater the difference between the purchase and sale price of the market maker. Thus, the volatility of stocks affects the liquidity of the market [7]; · Fourth, hedging methods such as portfolio insurance are affected by the level of volatility, while insurance prices increase with volatility [7]; Fifth, economic and financial theory suggests that consumers are risk averse. Consequently, the increased risk associated with a certain economic activity should lead to a decrease in the level of participation in this activity, which will have adverse consequences for investments [7]; · Finally, increased volatility over time may prompt regulators and capital providers to force firms to allocate a larger percentage of available capital to investments in monetary terms, which may harm the efficiency of distribution [7].
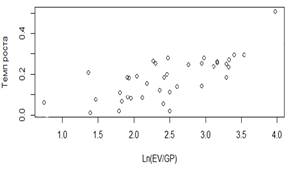
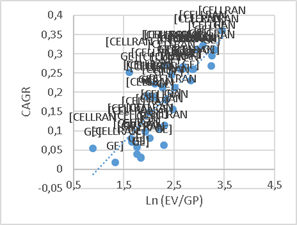
The simplest and most common indicator of stock market volatility is the standard deviation of profitability (see articles by Kevin Daly "Financial volatility: Issues and measuring techniques" [7, p.2377], Engle, Robert F., Manganelli, Simone: "Value at risk models in finance [8] and [9]) Estimates of the standard deviation of the sample from the daily yield serve as a useful measure to characterize the evolution of volatility. At the same time, it is known that the measure of volatility that focuses on the uncertainty aspect is the RMS percentage error (RMSPE) - this is a simple and well-known measure of forecasting errors [7, p.2380]. To empirically assess the volatility of a stock's price, its price is usually monitored at fixed intervals. These intervals can be days, weeks or months. However, before making any calculations, it is necessary to answer the question whether the volatility of the instrument traded on the exchange is the same when the exchange is open and when it is closed. Some people claim that information comes even when the exchange is closed, and this should affect the price. Many empirical studies have been conducted [7],[8],[9],[10], and researchers have found that volatility is much higher when the exchange is open. Note two common and actively used types of volatility: 1. Historical volatility is the volatility of a number of stock prices when we look back at the historical trajectory of the price of a particular stock [11]. Historical volatility is the easiest parameter to calculate, since it is calculated based on historical data as the average square deviation of the price for the period.; 2. Expected (implied) or imputed volatility. This indicator characterizes the volatility of asset prices in the future. According to the information provided on the Bloomberg website, this indicator for stocks is calculated based on daily quotes of options. Descriptive data analysis Now let's go directly to identifying the relationship between financial multipliers and expected volatility in relation to the object of research. The information base of the study was statistical data on 38 of the largest public companies in the software sector, obtained from the database of Bloomberg, one of the largest providers of financial information for professional participants in financial markets. This study examines companies that are traded on the American stock market, which "are represented by a set of exchange platforms, over-the-counter platforms, as well as a variety of stocks and other securities traded in these places. The main exchanges in America are NYSE, NASDAQ and AMEX" [12]. Statistical indicators will be analyzed for the following time slices: February 26, 2021; November 27, 2020; August 31, 2020; May 29, 2020; February 28, 2020; November 29, 2019. To reduce the spread, the transition from the values of the multipliers to their natural logarithms was carried out. As part of the next stage of the analysis, scatter plots (scatter diagrams) are constructed for preliminary determination of the degree of connection and its strength between the natural logarithm of the multiplier . They allow us to identify the presence of a relationship between the two factors under study. The results of the constructions are presented in Figures 1-6. . They allow us to identify the presence of a relationship between the two factors under study. The results of the constructions are presented in Figures 1-6. Figures 1-6 | Scatter diagram (26 February 2021)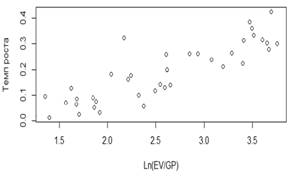 | Scatter diagram (27 November 2020)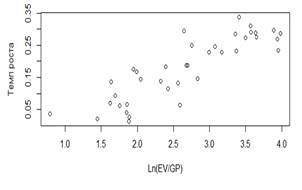 | | Scatter diagram (31 August 2020) 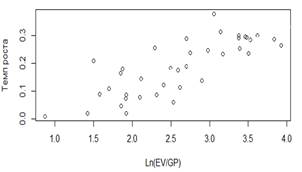
| Scatter diagram (29 May 2020)
| | Scatter diagram (28 February 2020) 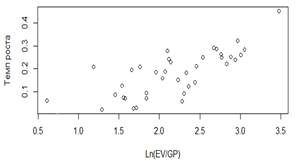
| Scatter diagram (29 November 2019) 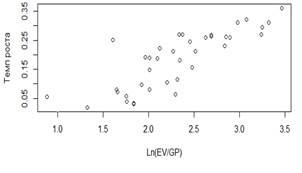
| Graphs of the spread of the natural logarithm of the Ln multiplier(EV/GP) and growth rates on 6 time slices Source: built by the authors according to Bloomberg The constructed graphs allow us to conclude that there is a direct relationship between the natural logarithm of the Ln multiplier (EV/GP) and the growth rates of companies. To assess this type of dependence, we proceed to the construction of nonparametric models of paired regression, using the example of the Tail model, which is characterized by the absence of strict requirements and assumptions for the distribution of statistical data [14]. Construction of nonparametric Tail models The Teil method [15], introduced in 1950, is popular among methods for constructing nonparametric regression models [16]. According to the methodology of constructing a nonparametric Tail regression model, within the framework of this study, nonparametric paired regression models were constructed for 6 time slices, where the natural logarithm of the multiplier value was taken as an independent variable, and the growth rate was taken as a dependent variable. According to the statistical data provided by Bloomberg, using the R-studio software, coefficients for the regression model were obtained according to the data of February 26, 2021. The test results are presented in Table 5. Table 5 | Time slice | Model Specification | Significance of coefficients | | 
| 
| | February 26, 2021 | 
| *** |
*** | | November 27, 2020 | 
| *** | *** | | August 31, 2020 | 
| *** | *** | | May 29, 2020 | 
| ** | *** | | February 28, 2020 | 
| *** |
*** | | November 29, 2019 | 
| *** | *** | 0 ‘***’ 0.001 ‘**’ 0.01 ‘*’ 0.05 ‘.’ 0.1 ‘ ’ 1 Specification and significance of nonparametric model coefficients for 6 time slices Source: built by the authors according to Bloomberg Checking the significance of the coefficients showed that all the coefficients of the constructed models are significant, therefore, it can be concluded that the relationship between the natural logarithm of the multiplier and the growth rate of companies in the software sector is stable in the coronavirus time. After analyzing the specifications of the models, you can proceed to the construction of the most nonparametric model for 6 time slices. The results of the constructions are presented in Figures 7-12. Figure 7-12 | 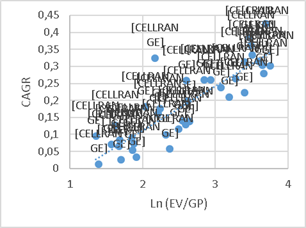
February 26, 2021 | 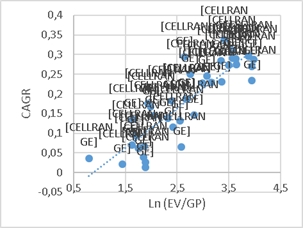
November 27, 2020 | | 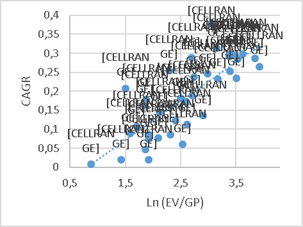
August 31, 2020 | 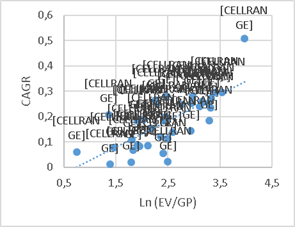
May 29 , 2020 | | 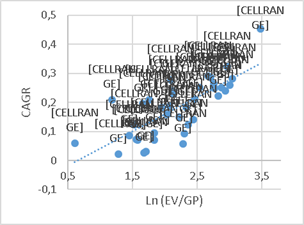
February 28, 2020 |
November 29 , 2019 | Nonparametric model for 6 time slices Source: built by the authors according to Bloomberg Correlation analysis to identify undervalued and overvalued companies Continuing the analysis, it should be noted that the main idea implemented by the authors in this article was the desire to find a relationship between the error in the evaluation of the company, that is, its undervaluation or overvaluation, and the level of expected volatility. The location of companies above or below the regression lines constructed in the previous chapters characterizes companies as undervalued or overvalued. The test results are shown in Figure 13. Figure 13 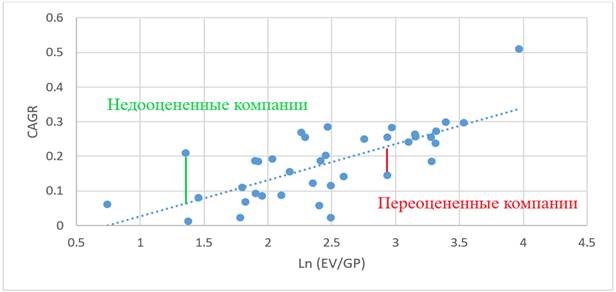
Undervalued and overvalued companies Source: built by the authors according to Bloomberg As an indicator of the level of undervaluation or overvaluation of companies in this approach, the value of the residuals of the nonparametric regression model will be used: 
The higher the value of this indicator (modulo), the more undervalued or overvalued the company in question is. Accordingly, the closer a company is to the curve, the more fair its valuation is. At the same time, the deviation of the actual values of growth rates from those obtained using nonparametric Tail regression models constructed in the previous chapter indicates that some companies are undervalued, and the other is overvalued. Having considered the descriptive statistics of the level of undervaluation/overestimation on 6 time slices, we can say that, on average, the estimates of companies based on the constructed models are fair. The test results are presented in Table 2. Table 2 | Time slice | Average value | Standard deviation | | February 26, 2021 | 0.016 | 0.058 | | November 27, 2020 |
-0.01 | 0.049 | | August 31, 2020 | -0.017 | 0.061 | | May 29, 2020 | -0.006 | 0.071 | | February 28, 2020 | 0.019 | 0.065 | | November 29, 2019 | -0,0069 | 0.058 | Descriptive statistics of the level of undervaluation/overestimation on 6 time slices Source: calculated by the author according to Bloomberg Visualization of distributions of undervaluation/overvaluation levels of companies by constructing histograms allowed the authors to make some assumptions about the normal law of distribution of model residuals on the time slices under consideration. To test this hypothesis, the Shapiro-Wilk test was conducted and the test results are presented in Appendix 3. It turns out that testing for the normality of the distribution of undervalued/overvalued levels of software sector companies allowed us to conclude that the distribution of this indicator on all time slices is similar to normal. Therefore, further calculation of Pearson correlation coefficients and conclusions about significance can be considered correct. The test results are presented in Table 3. Table 3
| | t-statistics | p-value | 95% interval | Point estimation | | 26.02.2021 | 2.829 | 0.008 | 0.124 - 0.657 | 0.426 | | 27.11.2020 | 1.008 | 0.32 | -0.163 - 0.461 | 0.166 | | 31.08.2020 | 1.934 | 0.061 |
-0.014 - 0.57 | 0.307 | | 29.05.2020 | 3.575 | 0.001 | 0.23 - 0.715 | 0.512 | | 28.02.2020 | 4.327 | 0.0001 | 0.326 - 0.762 | 0.585 | | 29.11.2019 | 3.154 | 0.003 | 0.171 - 0.683 | 0.465 | The results of testing the Pearson correlation between the level of undervaluation/overvaluation of companies and the expected volatility on 6 time slices Source: calculated by the authors according to Bloomberg data Based on modeling and calculations, we come to the conclusion that the expected volatility is indeed positively related to the level of undervaluation/overvaluation of companies. However, it should be noted that this relationship in accordance with the values of the Pearson correlation coefficients is not strong, which became a prerequisite for further study of the problem and achieving more stable research results.
Identification of correlation dependence by profitable and unprofitable companies To improve the results of the study, there is an assumption about the division of the studied sample into 2 groups, namely: 1. Companies generating net profit; 2. Unprofitable companies. This division is justified from the point of view that the level of risk is perceived differently in these two groups. In addition, profitable companies often compete for a place in the investment portfolio with more conservative asset classes (for example, bonds). In this regard, for profitable companies, a decrease in yields on the debt market will be regarded as a positive factor. At the same time, for unprofitable companies, this fact will be regarded rather in a negative way, as it indicates current problems in the economy, which may complicate the situation for companies that do not yet generate net profit. As for profitable companies, there are 18 of them in the initial sample of 38 companies in the software sector, and for them the hypothesis is put forward that there is a closer connection, that is, a higher Pearson correlation coefficient. The test results are shown in Figures 14-19. Figure 14-19 | 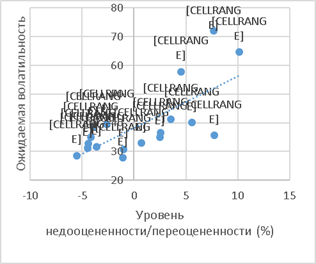
February 26, 2021 | 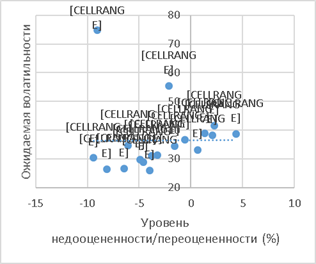
November 27, 2020 | | 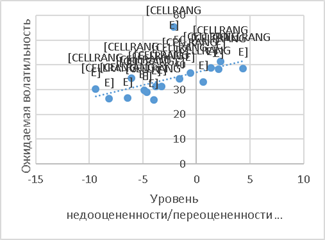
August 31, 2020 | 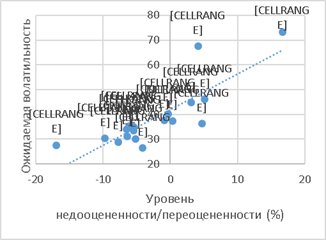
May 29 , 2020 | | 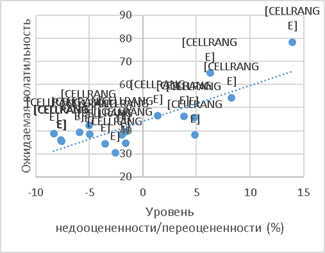
February 28, 2020 | 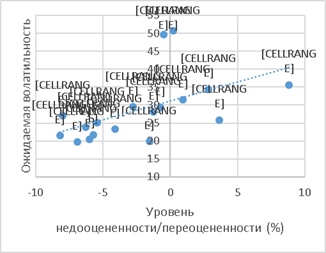
November 29 , 2019 | The relationship between the level of undervaluation/overvaluation of profitable companies and expected volatility Source: built by the authors according to Bloomberg As you can see on the charts, undervalued companies, that is, having a positive value of the undervaluation/overvaluation level, differ greatly in the level of expected volatility.
On the time slice of November 27, 2020, there was a violation of the general trends for the sample of profitable companies, namely, the Zoom company is very different from the rest of the sample. It turns out that the Pearson correlation coefficient calculated for 18 profitable companies in the software sector was 0.003, which indicates that there is no correlation between the indicators. Due to the spread, it would be advisable to exclude Zoom from the sample of profitable companies, and the Pearson correlation coefficient becomes equal to 0.557. Similar calculations were carried out for all time slices and for unprofitable companies. The results are presented in Figures 20-25. Figure 20-25 | 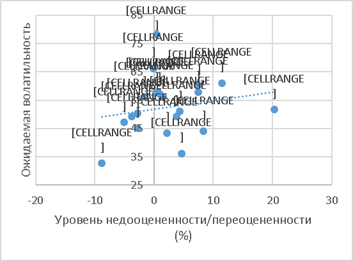
February 26, 2021 | 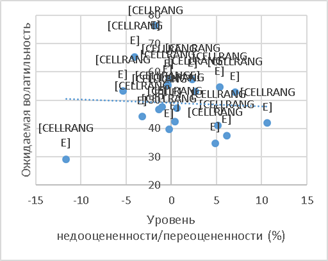
November 27, 2020 | | 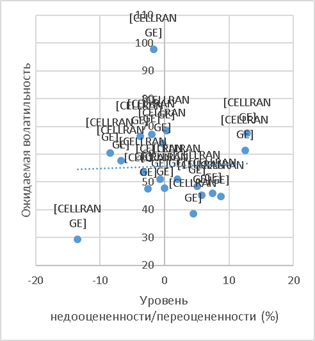
August 31, 2020 | 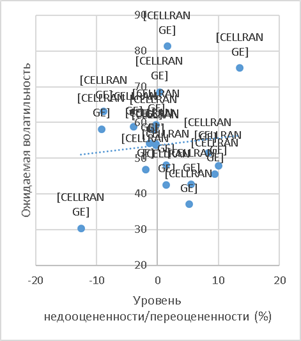
May 29 , 2020 | | 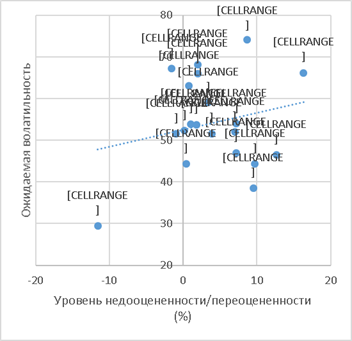
February 28, 2020 | 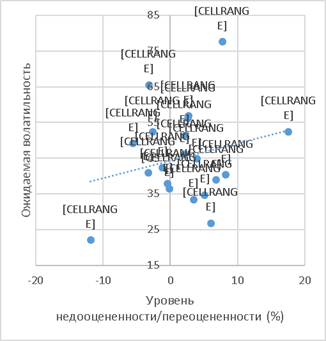
November 29 , 2019 | The relationship between the level of undervaluation/overvaluation of unprofitable companies and the expected volatility according to the nonparametric Tail model Source: built by the authors according to Bloomberg The generalized results of the correlation study between the indicators are presented in Table 4. Table 4 | Time slice | Initial selection | Profitable companies |
Unprofitable companies | | 26.02.2021 | 0.426 | 0.712 | 0.193 | | 27.11.2020 | 0.166 | 0,557 (Z) | -0.056 | | 31.08.2020 | 0.308 | 0.364 | 0.038 | | 29.05.2020 | 0.512 | 0.828 | 0.11 |
| 28.02.2020 | 0.585 | 0.809 | 0.225 | | 29.11.2019 | 0.465 | 0.528 | 0.229 | (Z) - Zoom is excluded from the sample of profitable companies Pearson correlation coefficients between the level of undervaluation/overvaluation of companies and expected volatility on 6 time slices Source: built by the authors according to Bloomberg Thus, the division of companies allowed us to achieve two significant results: 1. The correlation between the level of undervaluation/overvaluation of companies and the expected volatility increases with the transition from the initial sample to profitable companies; 2. In the sample of unprofitable companies, the relationship between the level of expected volatility and the level of undervaluation/overvaluation of companies is weak (the sign of the coefficient changes, it is not possible to characterize it in a uniform way for all the time slices under consideration) or completely absent. It should be noted that the hypotheses put forward at the initial stage of the study were not refuted. Conclusion The study of the approach to evaluating companies using multipliers allowed us to competently form a sample and select the necessary indicators for further research of multipliers, taking into account the basic requirements for evaluating companies using this method. The constructed models made it possible to identify undervalued and overvalued companies in the sample under study, the level of undervaluation/overvaluation of companies was calculated as the distance from the point to the regression line of the constructed models for each time slice.
Further study of the relationship between the level of undervaluation / overvaluation of companies and the expected volatility revealed the presence of a correlation between the indicators, which can be interpreted as a moderate direct relationship between the level of undervaluation / overvaluation of companies and the expected volatility. To refute or confirm the assumption that the relationship between the indicators for profitable and unprofitable companies may have a different nature and strength of dependence, the initial sample was divided into 2 parts by the factor of generating net profit by the company, that is, profitable and unprofitable companies. This division was justified, since the level of risk is perceived differently in these two groups. In addition, profitable companies often compete for a place in the investment portfolio with more conservative asset classes (for example, bonds). In this regard, for profitable companies, a decrease in yields on the debt market will be regarded as a positive factor. At the same time, for unprofitable companies, this fact will be regarded rather in a negative way, as it indicates current problems in the economy, which may complicate the situation for companies that do not yet generate net profit. The correlation analysis showed that, indeed, the relationship between the level of undervaluation/overvaluation of companies and the expected volatility for a group of companies generating net profit has become stronger than in the original sample. The nature of the connection has not changed, it has also remained straight, but on some time slices its strength has increased. As for unprofitable companies that do not yet generate net profit, completely different results have been achieved. Firstly, the connection was either practically absent or weak. At the same time, it should be noted that the correlation coefficient calculated for November 27, 2020 has changed its sign, that is, the dependence has become inverse, but at the same time very weak. The results achieved in this article allow all participants of the securities market to choose the most attractive in terms of expected volatility, even among undervalued companies. Applications Appendix 1 | | W-statistics | p-value | | 26.02.2021 | 0.956 | 0.144 | | 27.11.2020 | 0.935 | 0.029 | |
31.08.2020 | 0.948 | 0.079 | | 29.05.2020 | 0.938 | 0.035 | | 28.02.2020 | 0.958 | 0.163 | | 29.11.2019 | 0.933 | 0.026 | Results of the Shapiro-Wilk test for the normality of the distribution of growth rates on 6 time slices Source: calculated by the authors according to Bloomberg data Appendix 2 | | W-statistics | p-value | | 26.02.2021 | 0.863 |
0.0003 | | 27.11.2020 | 0.867 | 0.0003 | | 31.08.2020 | 0.893 | 0.002 | | 29.05.2020 | 0.862 | 0.0003 | | 28.02.2020 | 0.904 | 0.003 | | 29.11.2019 | 0.885 | 0.001 | Shapiro-Wilk test results for the normality of the EV/GP multiplier distribution on 6 time slices Source: calculated by the authors according to Bloomberg data Appendix 3 |
Time slice | W-statistics | p-value | | 26.02.2021 | 0.933 | 0.024 | | 27.11.2020 | 0.9567 | 0.148 | | 31.08.2020 | 0.97 | 0.398 | | 29.05.2020 | 0.982 | 0.797 | | 28.02.2020 | 0.987 | 0.925 | | 29.11.2019 |
0.986 | 0.905 | Results of the Shapiro-Wilk test for the normality of the distribution of the natural logarithm of the Ln multiplier(EV/GP) on 6 time slices Source: calculated by the authors according to Bloomberg data Appendix 4 The results of the division of companies into 2 groups based on the principle of generating net profit | Profitable companies | Unprofitable companies | | Microsoft Corporation, Oracle Corporation, International Business Machines Corporation, SAP, Adobe Inc., Salesforce.com Inc., Intuit Inc., Vmware Inc., ServiceNow Inc., Autodesk Inc., Citrix, Check Point, Synopsys, Fortinet, Akamai Technologies, Teradata, Zoom (Zoom Video Communications), Trade Desk Inc | Workday Inc., Palo Alto Networks, Splunk, HubSpot, Proofpoint, FireEye Inc., Nutanix, Black Knight Inc, Twilio,
MongoDB Inc, CloudFlare, CrowdStrike, Okta, Zscaler Inc, Zendesk, Atlassian, DocuSign, RingCentral, Coupa, Fastly Inc | Source: built by the authors according to Bloomberg [1] The study was supported by the grant of the Russian Science Foundation No. 20-68-47030.
References
1. Kurbatsky A.N., Manukyan S.G. "The impact of the expected growth rates of the company's profit on its current valuation on the example of the stock market of the United States of America." Finance, No. 12, p.50.
2. Yarovaya L., Elsayed A., Hammoudeh S.: Determinants of spillovers between Islamic and conventional financial markets: exploring the safe haven assets during the COVID-19 pandemic. Finance Res. Lett., 43. 2021.
3. Taleb, Nassim Nicholas. "Black Swan: Under the Sign of unpredictability" / Nassim Nicholas Taleb.-2nd ed., add.-Moscow: Kolibri, 2013 (Tula: Tula Printing House (JSC)).-735 p.; ISBN 978-5-389-04641-2
4. A.G. Gryaznova, M.A. Fedotova, M.A. Eskindarov, T.V. Tazikhina, E.N. Ivanova, O.N. Shcherbakova.Valuation of the enterprise (business). Moscow: Interreklama, 2003. p.130.
5. Gladilin A.A., Shmatko S.G. Valuation of securities based on multipliers // Economy. Business. Cans. 2015. No. 2 (11). p.5
6. Kevin Daly Financial Volatility: Issues and Measuring Techniques. Physica A: Statistical Mechanics and its Applications. Pp. 2377–2393.
7. Engle, Robert F. & Manganelli, Simone, 2001. "Value at risk models in finance," Working Paper Series 75, European Central Bank.
8. Andrew Patton: «What good is a volatility model?» Quantitative Finance, 2001, vol. 1, issue 2, 237-245
9. Althouse, Linda Akel; Ware, William B.; Ferron, John M. Detecting Departures from Normality: A Monte Carlo Simulation of a New Omnibus Test Based on Moments. Paper presented at the Annual Meeting of the American Educational Research Association (San Diego, CA, April 13-17, 1998). P.3.
10. Antonie Kotze: Stock Price Volatility: a primer // The South African Financial Markets Journal. 2005.
11. Development of science and technology: mechanisms for choosing and implementing priorities: collection of articles of the International Scientific and Practical Conference (December 25, 2019, Omsk) At 6 p.m.2. /-Ufa: AETERNA, 2017. p.108
12. Solonin C.I. Method of histograms // Ural Federal University. Electronic edition. 2014. p.7 URL: https://elar.urfu.ru/bitstream/10995/36132/1/solonin_2_2014.pdf.
13. Irma Lavagnini, Denis Badocco, Paolo Pastore, Franco Magno Theil–Sen nonparametric regression technique on univariate calibration, inverse regression and detection limits // Talanta. №87. 2011. P.187
14. H. Theil. A rank-invariant method of linear and polynomial regression analysis. I, II, III // Nederl. Akad. Wetensch., Proc. 1950. Т. 53. P. 389
15. N. Alp Erilli, Kamil Alakus Non-parametric regression estimation for data with equal values // European Scientific Journal. 2014. vol.10, No.4. P.75
Peer Review
Peer reviewers' evaluations remain confidential and are not disclosed to the public. Only external reviews, authorized for publication by the article's author(s), are made public. Typically, these final reviews are conducted after the manuscript's revision. Adhering to our double-blind review policy, the reviewer's identity is kept confidential.
The list of publisher reviewers can be found here.
The subject of the study. The article, based on the title, should be devoted to the study of the relationship between the level of expected volatility and multipliers in the US stock market. The content corresponds to the stated topic. Research methodology. The author uses a wide range of special methods aimed at substantiating the relationship between the studied indicators, but the results of mathematical calculations should be accompanied by their analysis and synthesis, which allows to identify problem points and formulate recommendations for their elimination, as well as proposals to ensure the socio-economic development of the state. The relevance of the study of the issues of determining various dependencies is always relevant. At the same time, it requires justification in the text of the impact of these changes on the Russian economy tactically and (or) strategically. The scientific novelty in the presented results is unambiguously contained and related to the substantiation of two facts: 1) "the correlation between the level of undervaluation/overvaluation of companies and expected volatility increases with the transition from the initial sample to profitable companies"; 2) "in the sample of unprofitable companies, the relationship between the level of expected volatility and the level of undervaluation/overvaluation of companies is weak or absent at all." At the same time, the practical significance of the results obtained, first of all, for the socio-economic development of the Russian Federation, requires justification. This, in many ways, will determine the interest of the readership in the content of the article. Style, structure, and content. The style of presentation is exclusively scientific. The structure of the article is not fully structured due to the lack of a block dedicated to discussing the results of the study, which allows you to compare the results with the results contained in the works of other authors, as well as draw conclusions from the results of calculations. The content of the article requires filling in economic conclusions (problems and ways to eliminate them) from the results of mathematical calculations made, as well as substantiating their significance for the Russian economy. Bibliography. The author of the article has compiled a bibliographic list consisting of 15 titles. It is valuable that it contains both domestic and foreign scientific publications. At the same time, the author should increase the number of relevant scientific papers devoted to the issues raised, including for discussions and a clear formation of scientific novelty and practical significance of the results obtained. It is also necessary to ensure the uniformity of the design of sources in accordance with the requirements of GOST. Appeal to opponents. Unfortunately, it was not possible to find in the text of the article a discussion of the results of the conducted scientific research with the results reflected in the works of other authors. When finalizing the article, the author is recommended to fix this problem. Conclusions, the interest of the readership. Taking into account all the above, it should be concluded about the high level of the analytical part of the study. Taking into account the interest of the scientific and expert communities, as well as representatives of public authorities to specific conclusions (problems and ways to solve them), the article requires further development in this direction, after which it will be of interest to a wide range of readers. The author is also recommended in the text to substantiate the importance of this topic for ensuring the socio-economic development of the Russian Federation. This will seriously expand the potential readership.
Link to this article
You can simply select and copy link from below text field.
|
|