|
DOI: 10.25136/2409-7802.2023.1.37548
EDN: WBBLRZ
Received:
15-02-2022
Published:
27-04-2023
Abstract:
The subject of the study is the processes of manipulation of stock asset prices on the example of shares of American high-tech companies of the NASDAQ exchange. The concept of manipulation of stock assets is formulated and the signs of manipulation of them are presented. The main purpose of the work is to identify signs of manipulation of the stock prices of Facebook, Nasdaq and Google companies from the moment of the initial public offering of the company's shares on the stock exchange (IPO) to the present. The methodology of the study includes statistical methods of data analysis: comparative analysis, correlation and regression analysis. Based on the annual quotes and financial reports of Facebook, Google and Nasdaq, a comparative and correlation analysis of the annual values of investment multipliers is carried out. Particular attention is paid to the comparative and statistical analysis of the data of these companies at the initial time stage after their IPO on the NASDAQ exchange. The result of the analysis showed a fairly strong correlation between them on this indicator. At the same time, a significant overvaluation of Facebook shares was established in the first years after its initial public offering on the stock exchange, in relation to the analog companies of Google and Nasdaq, as well as to the companies listed on the S&P500 stock market of the USA. The scientific novelty of the study lies in the fact that the presented methodology allows identifying signs of manipulation with the share prices of companies-analogues of any sufficiently liquid stock market. The topic of the article is of interest to stock market participants, stock analysts, potential investors and purchasers of companies, as well as to stock market regulators dealing with the reliability and security of its processes.
Keywords:
stock market, stock assets, stock information, company IPO, economic crisis, manipulation of stock assets, signs of manipulation, stock price, financial indicators of the company, investment multiplier
This article is automatically translated.
You can find original text of the article here.
IntroductionGlobal stock markets are financial institutions that perform the functions of redistributing free monetary resources used for the development and modernization of public companies, indirect movement and evaluation of ownership rights to securities and stock assets, as well as the redistribution of stock information and risks arising from this between participants in stock processes. From the very beginning of the stock markets, stock assets were manipulated by some of its participants in order to make a profit. Currently, due to the unprecedented development of the financial and stock sectors of the economy, their increasing influence on the entire world economy, the problem of studying the processes of manipulation of stock assets is relevant. The topical issues presented in this paper are actively investigated by the scientific community, whose interests lie in the analysis of stock markets and the processes of manipulation of stock assets. The negative use of insider information and price manipulation in the financial market is discussed in the article [1]. Using the example of the Russian financial market, a method for systematizing the positive and negative consequences of insider trading and price manipulation is proposed. On the basis of continuous, periodic and systematic control of the financial market, measures are presented for the possible prevention of unfair market practices, as well as to tighten responsibility for them. In [2] it is shown that manipulation increases volatility, liquidity and profitability of stocks, but worsens the efficiency of the market. The analysis of the dependence of manipulation on the volume of short sales and their awareness of market participants is devoted to the study [3]. It is revealed that manipulation takes place in informed trading with low volumes of short sales, reducing the informative value of prices and the investment potential of companies. At the same time, manipulation becomes less profitable as costs and informativeness increase. The irrational behavior of the securities market caused by price manipulation by market participants is analyzed in the article [4]. On the basis of two classes of price manipulation and their influence on market prices, the theory of the emergence of a "speculative bubble" is formulated. The study [5] shows that all methods of market manipulation are characterized by a single goal — informational influence on the perception of market participants about the value of a certain financial instrument. The concept of information manipulation in the markets is formulated, which combines both market manipulation and the misuse of insider information. The paper [6] analyzes the process of buying shares of a company on the secondary market for the purpose of hostile takeover. The main criteria of the takeover transaction are identified, methods of unfair manipulation of prices in order to underestimate their real value are listed. The process of manipulating the profits of companies during the procedure of their mergers and acquisitions is discussed in the article [7]. Based on data on mergers and acquisitions from 2003 to 2013, it is shown that acquiring companies overestimate profits by reducing discretionary expenses and manipulating sales to increase revenue. The article [8] is devoted to the theoretical and methodological aspects of assessing the reliability of the company's accounting statements. On the example of construction companies and companies engaged in mining, integral indicators for assessing the probability of distortion of the financial result in the financial statements are constructed. The presence of industry specifics in the selection of indicators characterizing the distortion of financial results of companies' activities has been established: indicators characterizing the distortion of reporting in mining companies differ from similar indicators in construction companies. The main groups of manipulations of financial statements of companies compiled according to international standards related to profits, cash flows and general financial indicators are analyzed in [9]. Examples of typical manipulations from Russian practice are given. The article [10] is devoted to the strategy of income manipulation. It is shown that they have a limited service life due to the fact that the high growth of net operating assets increases the risk of detection by auditors and regulatory authorities of the fact of manipulation and companies can no longer maintain the trend of manipulation. The manipulation of profits by Russian companies during their initial public offering is investigated in the article [11]. The data of a sample of 66 Russian companies from 2004 to 2016 are analyzed. Based on correlation and regression analysis, it is established that Russian companies manipulate profits in order to increase it in the year of the IPO, and the level of profit manipulation during the IPO is inversely dependent on the subsequent profitability of the company's shares, both at three-year and five-year intervals. In the study [12], based on the fractal market hypothesis, a method for detecting manipulation of stock prices in the secondary market of China is proposed. It is shown that a significant change in the price of shares alone is not enough to identify the facts of manipulation of them. At the same time, a sudden decrease in correlation dependencies between stock quotes is a confirmation of manipulation. The article [13] presents a specific trading scheme for manipulating prices on the stock market of Pakistan — "pumping and dumping". At low prices, manipulative brokers, colluding, carry out transactions with each other in order to artificially raise prices, while simultaneously generating positive feedback from traders for external investors – "pumping". When prices rise significantly, manipulative brokers sell the asset – "reset". In the study [14] from 2001 to 2017, on the basis of logistic regression, the specific characteristics of manipulator firms in the East Asian developing and developed markets are analyzed. It is shown that large and highly liquid companies are more likely to be manipulated than companies with high profitability, both in developing and developed markets.
The international experience of combating manipulative transactions in financial markets is analyzed in [15]. It is established that in order to achieve real results in the fight against manipulation in financial markets, it is necessary to improve legislation, supervision and law enforcement systems in this area, as well as close interaction and cooperation of all financial market participants. The article [16] explores the legally prohibited types of exchange operations, and schemes of market manipulation based on such operations. It is revealed that price manipulation in the securities market is reduced to the formation of false information for market participants, as a result of which an erroneous idea of the state of the market may be created, which entails damage to the image of the securities market. The analytical basis for understanding manipulations within the framework of US federal law for the successful prosecution of the most intractable violations of financial law in this area is considered in [17]. The tools of microstructure economics and company theory are analyzed to identify various forms of manipulation and determine their negative impact. Various aspects of the concept of insider information and market manipulation are analyzed in [18]. It is revealed that the Anglo-Saxon legislation, unlike the Russian one, when considering the phenomenon of market manipulation is based on specific previous court decisions (case law). It is shown that one of the main tasks of the Russian legislation on the way to the formation of an effective financial market and a favorable investment climate in the country is to take into account foreign experience in combating insider trading and market manipulation. The legal basis and the basis of modern Russian legislation on the misuse of insider information and market manipulation were laid down in Federal Law No. 224–FZ of 27.07.2010. It defines insider information and lists situations in which the use of insider information is prohibited, as well as actions related to stock market manipulation. At the same time, control over compliance with the requirements of the legislation is assigned to the Central Bank of the Russian Federation. An analysis of the literature on the subject under consideration showed that the following practices of manipulation of stock assets are currently common: · use of insider information; · various trading techniques and technologies affecting stock market participants; · misrepresentation of the company's accounting and financial statements. Manipulation of stock prices leads to distortion of market prices for stock assets, thereby having a negative impact on attracting investments of bona fide stock market participants into the economy. Therefore, the timely identification of manipulation is an urgent problem, in the study of which the scientific community in the previously cited articles identified various signs of manipulation with stock prices: · increased volatility, liquidity and profitability of stocks with a decrease in market efficiency; · low volumes of short sales with a decrease in informed trading; · manipulation becomes less profitable as the costs and information content of stock processes increase; · increase in integral indicators for assessing the probability of distortion of the financial result in the financial statements of companies; · profit manipulation during an IPO inversely depends on the subsequent profitability of the company's shares; · sudden decrease in correlation dependencies between stock quotes of the same type of companies. This article presents a methodology for identifying signs of manipulation using investment multipliers (indicators), the values of which, on the one hand, depend on subjective data — stock market quotations (formed on the basis of the balance of supply and demand by stock market participants), and on the other hand — on objective financial and economic indicators of companies. If we accept the rational hypothesis that objective financial and economic indicators of a company in a stable economy determine the market price of its shares, then investment multipliers for certain economic conditions and taking into account the degree of development of economic relations for each country should have some optimal values (intervals of values). Deviations from these values will mean that the stock in question is valued by the stock market not according to its fundamental indicators, that is, there is manipulation of its market price. The purpose of this article is to identify signs of manipulation of stock prices on the example of high-tech companies of the NASDAQ exchange. The study of manipulation of stock assets is carried out on the example of the US stock market as one of the most liquid and legally protected, including from manipulation of stock assets. The implemented methodology for identifying manipulations of US stock assets is generally applicable to any liquid stock markets, including the Russian one. The approbation of the presented methodology for the Russian stock market is expected in the author's future research. Attention is focused on the comparative and correlation analysis of the dynamics of quotations and investment multipliers of the largest American high-tech companies Facebook, Google and Nasdaq since their Initial Public Offering (IPO) on the stock exchange. It is assumed that regardless of the moment of the IPO on the stock exchange, the global dynamics of their investment indicators will have a correlation dependence. The information base of this study was: annual financial reports of Facebook, Google and Nasdaq companies posted on their official websites; historical stock quotes of these companies presented on the websites of American stock exchanges. The methodological basis of the study includes statistical methods of data analysis: comparative analysis, correlation and regression analysis. Statistical calculations and the formation of charts of the dynamics of company indicators are implemented in Excel. The concept and methods of manipulation of stock assets
Since the beginning of the emergence of stock markets, it was assumed that they would serve as a mechanism for the natural selection of the strongest and most efficient enterprises in terms of their production and financial indicators, as well as act as a financial platform for competition for investors' funds. However, in the process of globalization, there has been a rapid increase in the share of the financial sector of the world economy and stock assets. This has led to a significant imbalance between the manufacturing and financial sectors of the world economy. The global economic crisis of 2008 and the socio–economic consequences of the COVID-19 pandemic have had and continue to have a significant impact on financial and stock markets, as a result of which there is an increase in the volatility of stock asset prices and an increase in the risks of manipulation of them. The processes of manipulation of stock assets are understood as a set of targeted impacts (informational, financial, economic, political, etc.) of the subject of manipulation on stock market participants to stimulate their joint activities aimed at forming the target value of stock assets. The subject of manipulation may be a specific individual or legal entity, a single or collective person — a participant in the stock market, which exerts influence in order to distort the market price of a stock asset. The main feature of manipulation is a significant difference between stock quotes of a stock asset that arose as a result of the manipulation subject's action on stock market participants, and stock quotes of a stock asset that would have been formed without such an action. One of the most common types of manipulation is the distortion of stock information. The main purpose of all hidden illegitimate influences on the sources of stock information is to give a certain trend to the feeling of risk to stock market participants associated with a specific stock asset. The achievement of such a goal is reflected in the planned dynamics of the market value of the selected stock asset, while its real economic condition does not undergo any changes. The target distorting (manipulated) effect is exposed only to stock information, and not the real state of the corresponding stock asset. This is due to the fact that it is precisely the concealment of the real state of this asset that is the purpose of manipulating stock information. The ultimate expression of achieving the goal of manipulating stock information is the risk space of mass decision-making by stock market participants, which corresponds to a certain behavior of estimated economic indicators of a particular segment or asset of the stock market. The following methods of manipulating a stock asset based on the distortion of stock information are distinguished: · mythologization of the issuing company, implemented with the help of various myth-making technologies: the use of mass media to disseminate "necessary" leaks about the state of the company; the formation, with the help of interested stock analysts, of its mythological image necessary for the purposes of the manipulator; · distortion of specific results of the company's financial and economic activities by introducing distorted and/or fictitious information into the accounting system that would meet the goals of the subjects of manipulation; · manipulation of the internal and external risk of the issuing company (strategic, financial, project, environmental, software, technological, operational, personnel, legal, reputational, etc.). Comparative analysis of the dynamics of quotations of American high-tech companies Facebook, Google and Nasdaq since their placement on the stock exchangeIn the process of initial public offering of company shares (IPO) on the stock exchange, various ways of manipulating stock assets are often used to achieve the highest possible price. To identify possible signs of manipulation, the fundamental and stock indicators of high-tech companies Facebook, Google and Nasdaq are compared since the beginning of their initial placement on the stock exchange. During the IPO in May 2012, Facebook placed more than 400 million of its shares on the NASDAQ stock exchange at a price of about $ 38 for a total amount of about $ 18.4 billion [19]. On the first day of trading after the IPO procedure, the share price rose from $38 to $45. However, in the future, the company's stock prices decreased by almost 54%, reaching a low of $17.73 in September 2012. At the same time, the owners of the company and the banks participating in the IPO (Morgan Stanley, JP Morgan and Goldman Sachs) could not have been unaware of the current fundamental and financial condition of the company. In mid-2013, Facebook shares reached the level of the placement price and continued to grow. By the end of 2013 the share price level reached 54.64 USD [20]. Facebook's announcement on the inclusion of the company's shares in the SP500 listing and the new public offering of 70 million ordinary shares at the price of 55.05 US dollars (Facebook. https://investor.fb.com/investor–news/press–release–details/2013/Facebook–Announces–Pricing–of–Follow–On–Offering12202013/default.aspx). Thus, in the first year after the IPO procedure, there was significant volatility in Facebook's stock quotes, while the shares reached their maximum prices during the placement. One of the main indicators characterizing the comparative assessment of the investment attractiveness of joint-stock companies is the multiplier, the value of which is calculated by the formula:
 , (1) , (1)
This investment multiplier, equal to the ratio of the exchange value of a share (P) to earnings per share (EPS), characterizes a comparative assessment of the investment attractiveness of joint-stock companies. Let's consider the data of the values of investment multipliers for Facebook, Google and Nasdaq companies since their IPO. Table 1 presents Facebook's annual financial and market indicators from the beginning of the IPO in 2012 to 2020: earnings per share — EPS; share price — P; investment multiplier — P/EPS. Table 1 — Financial indicators and stock quotes of Facebook | Year | EPS, US dollars | P, US dollars | P/EPS | | 2012 | 0,02 | 26,62 | 1331,00 | | 2013 | 0,62 | 54,65 | 88,15 | | 2014 | 1,12 |
78,02 | 69,66 | | 2015 | 1,31 | 104,66 | 79,89 | | 2016 | 3,56 | 115,05 | 32,32 | | 2017 | 5,49 | 176,46 | 32,14 | | 2018 | 7,65 | 131,09 | 17,14
| | 2019 | 6,48 | 205,25 | 31,67 | | 2020 | 10,22 | 273,16 | 26,73 | Source: compiled by the author based on Facebook data [20, 21] The data in Table 1 show that the P/EPS multiplier during 2012-2020 takes an average value of M = 169.71, and for 2013-2020: M = 47.21. For comparative analysis, as an analog company, we can consider the financial and market indicators of Google, which, similarly to the case of Facebook, represents the high-tech sector of the American economy. Table 2 shows its annual financial and market indicators for the period 2004-2020. (since the IPO). Table 2 — Annual financial and market indicators of Google | Year | EPS, US dollars | P, US dollars | P/EPS | | 2004 | 2,07 | 96,50 |
46,62 | | 2005 | 5,31 | 207,60 | 39,10 | | 2006 | 10,21 | 230,50 | 22,58 | | 2007 | 13,53 | 346,10 | 25,58 | | 2008 | 13,46 | 154,00 | 11,44 | | 2009 |
20,62 | 310,30 | 15,05 | | 2010 | 26,69 | 297,30 | 11,14 | | 2011 | 30,17 | 323,30 | 10,72 | | 2012 | 32,31 | 354,00 | 10,96 | | 2013 | 37,64 |
560,90 | 14,90 | | 2014 | 20,57 | 530,70 | 25,80 | | 2015 | 22,84 | 778,00 | 34,06 | | 2016 | 27,85 | 792,50 | 28,46 | | 2017 | 18 | 1 053,40 | 58,52 |
| 2018 | 43,7 | 1 045,00 | 23,91 | | 2019 | 49,16 | 1 339,40 | 27,25 | | 2020 | 58,61 | 1 752,60 | 29,90 | Source: compiled by the author based on Google data [22, 23] According to Table 2, the average calculated value of Google's multiplier M for 2004-2020 takes the value M = 25.65. Table 3 shows Nasdaq's annual financial and market indicators for the period 2005-2020. (since the IPO). Table 3 — Annual financial and market indicators of Nasdaq | Year | EPS, US dollars | P, US dollars | P/EPS |
| 2005 | 0,57 | 35,18 | 61,72 | | 2006 | 0,95 | 30,79 | 32,41 | | 2007 | 3,46 | 49,49 | 14,30 | | 2008 | 1,55 | 24,71 | 15,94 | | 2009 | 1,25 |
19,82 | 15,86 | | 2010 | 1,91 | 23,73 | 12,42 | | 2011 | 2,15 | 24,51 | 11,40 | | 2012 | 2,04 | 24,99 | 12,25 | | 2013 | 2,25 | 39,80 |
17,69 | | 2014 | 2,39 | 47,96 | 20,07 | | 2015 | 2,50 | 58,17 | 23,27 | | 2016 | 0,63 | 67,12 | 106,54 | | 2017 | 4,30 | 76,83 | 17,87 | | 2018 |
2,73 | 81,57 | 29,88 | | 2019 | 4,63 | 107,10 | 23,13 | | 2020 | 5,59 | 132,74 | 23,75 | Source: compiled by the author according to Nasdaq [24, 25] According to Table 3, the average value of the Nasdaq P/EPS multiplier for 2005-2020 is 27.41, which is very close to the average value of this Google multiplier in 2004-2020 — 25.65 (Table 2). At the same time, the average value of a similar Facebook multiplier since the IPO is 169.71. If the multiplier value for 2012 (the year of the IPO) is excluded from the calculation, the average multiplier value for 2013-2020 is 47.21 (Table 1). The investment multiplier P/EPS is equal to the ratio of the company's capitalization to the annual net profit, which is equivalent to the ratio of the value of the stock to its earnings per share. The value of this multiplier can be interpreted as the number of years required for the company to return the invested funds, provided that the current size of its annual net profit is maintained. Financial analysts adhere to two approaches to the interpretation of this multiplier. The first, which can be called rational, states that the larger this multiplier, the greater the risks of investing in this company, i.e. its shares are overvalued. It is usually considered (for developed economies) that for attractive companies from the point of view of investment, the average value of P/EPS should not exceed 15. The second (conditionally irrational) one is based on the position that it is the stock market participants who determine the "fair" share price, i.e. the higher the P/EPS indicator, the more interesting the company is in the opinion of market participants and, therefore, attractive for investment, and the lower its value, the less attractive the company is for investment. This logic of assessing the investment attractiveness of companies often leads to inflating price "bubbles". As a rule, investment multipliers of companies in the historical perspective tend to tend to the average value for the industry and for the stock market as a whole. For American companies that are part of the S&P500 index, the average value of the P/EPS multiplier from 2004 to 2020 is 24.985. At the same time, the minimum and maximum values of this multiplier for the same time period are 13.32 and 33.31, respectively [26, 27]. Therefore, we can expect that Facebook's P/EPS multiplier will take a value close to 25 in the future.
The results of the comparative analysis show that the average values of the Nasdaq P/EPS multiplier for 2005-2020 (27.41) and Google for 2004-2020 (25.65) are quite close to each other and are in the above range of minimum and maximum average values of this S&P500 multiplier — from 13.32 to 33.31. On the other hand, the average value of this Facebook multiplier since the IPO goes far enough beyond the range of minimum and maximum average values of S&P500 companies. Correlation analysis of investment multipliers of Facebook, Google and Nasdaq companiesIn order to assess the consistency of changes in the P/EPS multiplier for each pair of Facebook, Google and Nasdaq companies and significance levels ?= 0.05, a correlation analysis is carried out, including: calculation of the correlation coefficient and determination; determination of Student coefficients and the critical value of the Student criterion; evaluation of the statistical significance of correlation coefficients. Table 4 shows the correlation coefficients, determinations and Student coefficients for these companies, obtained as a result of correlation analysis of P/EPS values for the first 9 years after their IPO. This choice of time interval for analysis is due to the total time of Facebook stock quotes on the NASDAQ stock exchange since the IPO. Table 4 — Correlation coefficients, determinations and Student coefficients of P/EPS values between Facebook, Google and Nasdaq companies since their IPO | The company | Google, Facebook | Nasdaq, Facebook | Nasdaq, Google | | Correlation coefficient | 0,74 | 0,94 | 0,87 | | Coefficient of determination | 0,55 | 0,87 | 0,77 | | Student's Coefficient |
2,93 | 7,00 | 4,77 | The correlation coefficients between Facebook, Google and Nasdaq, obtained as a result of the correlation analysis of the values of the P/EPS indicator from 2012 to 2020, are shown in Table 5. Table 5 — Correlation coefficients of P/EPS values between Facebook, Google and Nasdaq from 2012 to 2020 | The company | Google, Facebook | Nasdaq, Facebook | Nasdaq, Google | | Correlation coefficient | –0,49 | –0,25 | 0,03 | The values of the correlation and determination coefficients in Table 4 show that there has been a fairly strong positive correlation between Facebook, Google and Nasdaq since their IPO in terms of P/EPS. The values of the Student coefficients in Table 4 are greater than the critical value of the Student criterion (2.36) calculated for the significance level ?= 0.05, which determines the statistical significance of the obtained correlation coefficients. Correlation coefficients between the same companies from 2012 to 2020 (Table. 5) show its absence. This confirms the assumption that, regardless of the year of the initial placement of these companies on the stock exchange, the global dynamics of their investment indicators P/EPS since the IPO has a correlation relationship. Facebook and Google, Facebook and Nasdaq, Google and Nasdaq, however, the obtained correlation dependence only demonstrates a consistent change in the values of the P/EPS indicator over a given period of time between Facebook and Google, and does not determine the magnitude of deviations of the P/EPS values of the companies in question from each other. Let's consider the dynamics of the values of P/EPS multipliers for Facebook, Google and Nasdaq companies from the year of their IPO and from 2012 to 2020. Fig. 3 and Fig. 4, based on the data in Tables 1-3, present comparative graphs of P/EPS multipliers for the three companies for the first 9 years after their IPO. 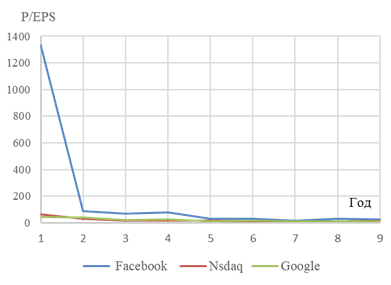
Figure 3 — Dynamics of P/EPS multipliers for Facebook, Google and Nasdaq (built by the author on the basis of Tables 1-3) 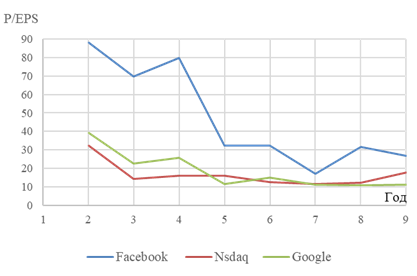
Figure 4 — Dynamics of P/EPS multipliers for Facebook, Google and Nasdaq companies from the second year after their IPO (constructed by the author based on Tables 1-3)
Comparison of the graphs in Fig. 3 and Fig. 4 for the P/EPS multiplier of Facebook and the Google and Nasdaq analog companies shows their significant difference, and this difference is especially pronounced in the first years after their IPO. Facebook and Google, as well as between Facebook and Nasdaq, have P/EPS multiplier scatter diagrams in Fig. 5 and Fig. 6. The right parts of these figures show the P/EPS scattering diagrams, including the first year of the IPO, the left parts show diagrams starting from the second year after the IPO. 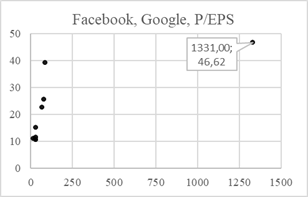 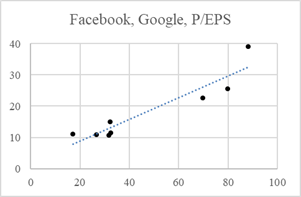
Figure 5 — Scatter diagram between Facebook P/EPS (horizontal scale) and Google P/EPS (vertical scale) (constructed by the author on the basis of Table. 1 and Table 2) 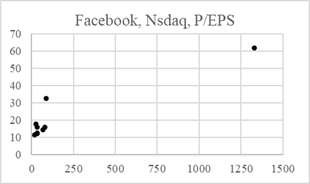 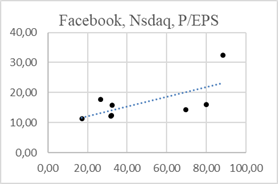
Figure 6 — Scatter diagram between Facebook P/EPS (horizontal scale) and Nasdaq P/EPS (vertical scale) (constructed by the author on the basis of Table. 1 and Table 3) The left diagrams in Figure 5-6 demonstrate that in the first two years after the IPO, the P/EPS values of Facebook differ significantly from the P/EPS values of Google and Nasdaq. At the same time, a particularly strong difference between the values of the indicator is observed in the first year of the IPO. The right diagrams of Fig. 5-6 (without data from 2012 — the year of Facebook's IPO), as well as the graphs in Figures 3-4, clearly show the tendency of the annual values of the P/EPS multipliers of the companies in question to the average value of the P/EPS of S&P500 companies to 25. ConclusionFacebook and Google, Facebook and Nasdaq, as well as Google and Nasdaq, conducted a correlation analysis of P/EPS indicators for the first 9 years after their IPO showed that there is a fairly strong correlation between them. At the same time, the correlation coefficients between the same indicators from 2012 to 2020 demonstrate its absence. Therefore, it is possible to recognize a consistent change in the values of P/EPS indicators since the beginning of the IPO of these companies, despite the different years of initial public offerings. Facebook and Facebook and Nasdaq's analogous companies P/EPS multiplier changes in the first years after their IPO, as well as the scatter charts of this indicator for Facebook and Google, Facebook and Nasdaq over the same time period, revealed their significant difference (Fig. 3-4, Fig. 5-6).. At the same time, a tendency of convergence of Facebook's annual P/EPS values to the average value of this multiplier for all S&P500 listing companies was found. It has been found that the average values of the P/EPS multiplier of Facebook, Nasdaq and Google companies have significantly differed from each other since the beginning of their IPO. If the average values of the P/EPS multiplier of Nasdaq (27.41) and Google (25.65) are almost equal and are in the range of minimum and maximum average values of this multiplier for S&P500 listing companies (from 13.32 to 33.31), then the average values of this multiplier of Facebook (169.71 for 2012-2020 and 47.21 for 2013-2020) from the date of the IPO, they are quite far beyond the range of minimum and maximum average values of S&P500 companies. Facebook's significant overvaluation in the first years after its initial placement in relation to Google and Nasdaq's analog companies, as well as to the S&P500 listed companies of the US stock market, is shown based on a comparative and correlation analysis of quotations and financial indicators of the Facebook, Nasdaq and Google analog companies. Taking into account the above concept of manipulation of stock assets, the established overvaluation shows that in the first years after the initial public offering of Facebook shares, manipulation of this stock asset may have taken place. The proposed methodology allows stock market participants, stock analysts and potential investors to identify signs of manipulation with the share prices of companies-analogues of any sufficiently liquid stock market, including the Russian one. On this basis, they can choose and implement the most preferred and less risky investment strategies. Stock market regulators are able to detect manipulation of stock assets in a timely manner, which allows them to timely introduce appropriate response measures to eliminate it. Based on the data on the signs of manipulation, the acquirers of companies get the opportunity for an adequate market assessment of the value of companies. For ordinary stock market investors, the information content, reliability and security of the process of investing in stock assets increases.
References
1. Lisitskaya T. S., Neyzhmak Y. S. (2017). Insider trading and manipulation of prices in the financial market. Internet–zhurnal «Naukovedenie», 4(9). Retrieved from http://naukovedenie.ru/PDF/69EVN417.pdf
2. Aggarwal, R. K., Wu, G. (2006). Stock market manipulations. The Journal of Business, 79(4), 1915–1953. doi:10.1086/503652
3. Campello, M., Matta, R., Saffi, P. (2020). Does Stock Manipulation Distort Corporate Investment? The Role of Short Selling Costs and Share Repurchases. SSRN. http://dx.doi.org/10.2139/ssrn.3669172
4. Martynenko V. A. (2007). Манипулирование ценами, как причина иррационального поведения рынка ценных бумаг [Price manipulation as a reason for irrational behavior of the securities market]. Инновации, 6 (104), 86-90.
5. Emelyanova E. A. (2013). Informative Nature of Market Manipulation. Vestnik of Saint Petersburg University. Law, 3(14), 23-31.
6. Gulyatkin A. I. (2016). Methods of price manipulation on a stock market during hostile takeover of a company. Vestnik Universiteta, (7-8),137-141.
7. Fasipe, O., Sun, HL. (2020). Real activities manipulation in stock-for-stock mergers. Journal of Economics and Finance, 44, 570–586. https://doi.org/10.1007/s12197-019-09500-9
8. Dudin S.A., Savel'eva M.Yu., Maksimenko I.N. (2018). Building an integrated index to assess the likelihood of overstated financial results in financial statements. Economic Analysis: Theory and Practice, 6(17), 1161-1177. https://doi.org/10.24891/ea.17.6.1161
9. Slabinsky D. V. (2011). Основные группы манипуляций в финансовой отчетности [The main groups of manipulations in financial statements]. Вестник БГТУ им. В.Г. Шухова, 1, 109-111.
10. Kevin, H. Kim, Derek, O. (2021). Net Operating Assets and Earnings Manipulation. SSRN. http://dx.doi.org/10.2139/ssrn.3918973
11. Nikulin E.D., Sviridov A.A. (2019). Earnings management by Russian companies at the initial public offering. Finance: Theory and Practice, 23(1), 147-164. https://doi.org/10.26794/2587-5671-2019-23-1-147-164
12. Zhou, F., Chen, R., Xia, X. (2003). Fractal character of stock price-volume relation and regulation of stock price manipulation. Fractals, 2(11), 173-181.
13. Khwaja, A.I., Mian, A. (2005). Unchecked intermediaries: price manipulation in an emerging stock market. Journal of Financial Economics, 1(78), 203-241.
14. Shah, S., Ismail, I., Shahrin, A. (2019). Stock market manipulation: A comparative analysis of East Asian emerging and developed financial markets. Management Science Letters, 9(1), 183–192.
15. Khudyakova L. S. (2011). International experience in combating manipulative transactions in financial markets. Journal of Money and Finance, 7, 65-70.
16. Mamochka E. A. (2014). Типы биржевых операций, посредством которых может быть осуществлено манипулирование рынком [Types of exchange operations through which market manipulation can be carried out]. Бизнес в законе. Экономико-юридический журнал, 5, 106-110.
17. Fox, Merritt B., Glosten, L. R., Rauterberg, G. V. (2018). Stock Market Manipulation and Its Regulation. Yale J. Reg, 1, 67-126.
18. Emelyanova E. A. (2012). Notions of insider information and market manipulation in Russian and foreign legislation: comparative and legal aspect. Vestnik of Saint Petersburg University. Law, 3(14), 14-30.
19. Official website of the Reuters. Facebook prices at top of range in landmark IPO. Electronic resource. URL: https://www.reuters.com/article/us-facebook-idUSBRE84G14Q20120517 (date of access: 15.12.2022).
20. Official website of the Meta. Historical Price. Electronic resource. URL: https://investor.fb.com/stock-info/?section=historicalprice (date of access: 15.12.2022).
21. Official website of the Meta. Financials. Electronic resource. URL: https://investor.fb.com/financials/default.aspx (date of access: 15.12.2022).
22. Official website of the Alphabet Inc. Class A Common Stock (GOOGL) Stock Price, Quote, News & History Nasdaq. Electronic resource. URL: https://www.nasdaq.com/market-activity/stocks/googl (date of access: 12.06.2022).
23. Official website of the Alphabet. Investor Relations. Electronic resource. URL: https://abc.xyz/investor/previous/ (date of access: 15.12.2022).
24. Official website of the Nasdaq, Inc. Common Stock. Electronic resource. URL: https://www.nasdaq.com/market-activity/stocks/ndaq (date of access: 12.06.2022).
25. Official website of the Nasdaq, Inc. Annual Reports. Electronic resource. URL: https://ir.nasdaq.com/financials/annual-reports (date of access: 15.12.2022).
26. Robert J. Shiller. (2005). Irrational Exuberance, 2nd ed. Princeton, NJ: Princeton University Press.
27. Campbell, J.Y., Shiller, R.J. (1988). Stock Prices, Earnings, and Expected Dividends. Journal of Finance, 43, 661–676
First Peer Review
Peer reviewers' evaluations remain confidential and are not disclosed to the public. Only external reviews, authorized for publication by the article's author(s), are made public. Typically, these final reviews are conducted after the manuscript's revision. Adhering to our double-blind review policy, the reviewer's identity is kept confidential.
The list of publisher reviewers can be found here.
Research on stock asset manipulation using the example of shares of American high-tech companies on the Nasdaq stock exchange. Asset manipulation on the stock market carries significant risks of inflating bubbles and sharp price fluctuations. The reason for manipulation in general is the asymmetry of information among market participants on the situation with a particular asset. The consequence, from a financial point of view, is an increase in financial results by some market participants at the expense of losses by others. Manipulation can have a negative impact on the economic situation in general, exacerbate economic instability when price fluctuations in a volatile market are used to manipulate and shake up the market. The presented article is devoted to the problems of stock asset manipulation research using the example of shares of American high-tech companies on the Nasdaq stock exchange. The title of the article corresponds to the content. The purpose of the study is to identify signs of manipulation of stock prices (stock assets) using the example of high–tech companies on the NASDAQ stock exchange. The article highlights sections with subheadings, which corresponds to the presented requirements of the journal "Finance and Management". In the "Introduction", the author characterizes the relevance and significance of the chosen research area, sets the purpose and objectives of the study, and also gives a fairly detailed overview of recent scientific research in the field under study. In the section "The concept and methods of manipulation of stock assets", the author classifies possible areas of manipulation in the markets, defines such categories as "manipulation of stock assets", "subject of manipulation", "sign of manipulation". The section "Comparative analysis of American high-tech companies Facebook, Google and Nasdaq since their listing on the stock exchange" is devoted to describing the results of a study of signs of manipulation of shares of the largest high-tech American companies based on the results of correlation analysis. It seems advisable to clarify the title of the section, since it is not a comparative analysis of companies, but a comparative analysis of the dynamics of stock quotes of companies. In conclusion, the author formulates conclusions based on the results of the study. The author believes that in the first years after the initial public offering of Facebook shares, manipulation of this stock asset may have taken place. The research uses well-known general scientific methods: analysis, synthesis, comparison, ascent from the abstract to the concrete, logical method, etc. Among the special economic methods, statistical methods of data analysis are used: comparative analysis, correlation and regression analysis. Statistical calculations and the formation of charts of the dynamics of company indicators are implemented in Excel. The chosen research topic is extremely relevant. This is due to the fact that in the context of crisis phenomena in the global economy against the background of global geo-economic uncertainty, the risks of market manipulation are significantly increasing. Their implementation may lead to an aggravation of the already difficult economic situation. Therefore, it is important to develop tools for identifying signs of manipulation in the market. The article has practical significance in terms of the possible application of correlation analysis to identify signs of manipulation in the stock market. However, there is no justification for using correlation and regression analysis. Its correctness is questionable given the narrow time range, the presence of outlier points illustrated in the graphs. Have the coefficients of determination and standard errors been calculated? Have the hypotheses been tested for significance? The research methodology is not described in this part. The author has not formulated the points of scientific novelty of the study, it is not obvious. We believe that the article should be supplemented with the author's vision of scientific novelty. This will increase the attractiveness of the research to the general readership of the journal. The use of correlation analysis in itself is not new in relation to the study of market manipulation, so it is not clear what the author suggests in this regard. The style of the article is scientific and meets the requirements of the journal. The bibliography is presented by 20 sources, which meets the requirements of the journal. The bibliography is formed primarily by foreign and domestic research in the field of market manipulation and identification. The information base of this study was: annual financial reports of Facebook, Google and Nasdaq companies posted on their official websites; historical stock quotes of these companies presented on the websites of American stock exchanges. The advantages of the article include the following. Firstly, the relevance and significance of the chosen research area. Secondly, a practical illustration of the process of identifying signs of manipulation in the stock market of high-tech American companies. Thirdly, the presence of illustrative material., which increases the level of perception of the material by readers. The disadvantages include the following. Firstly, the need to supplement the article with an explicit assessment of the elements of scientific novelty of the conducted research. Secondly, there is a lack of practical recommendations for identifying and eliminating market manipulation. Thirdly, the need for full disclosure of the methodology of applying correlation analysis to eliminate doubts about the correctness of its application in such a narrow time interval. These disadvantages need to be improved. Conclusion. The presented article is devoted to the problems of stock asset manipulation research using the example of shares of American high-tech companies on the Nasdaq stock exchange. The article reflects the results of the author's research and may arouse the interest of the readership. The article may be accepted for publication in the journal Finance and Management, provided that the comments indicated in the text of this review are eliminated.
Second Peer Review
Peer reviewers' evaluations remain confidential and are not disclosed to the public. Only external reviews, authorized for publication by the article's author(s), are made public. Typically, these final reviews are conducted after the manuscript's revision. Adhering to our double-blind review policy, the reviewer's identity is kept confidential.
The list of publisher reviewers can be found here.
The subject of the study. Based on the formed title, the article should be devoted to research on stock asset manipulation using the example of shares of American high-tech companies on the Nasdaq stock exchange. At the same time, this issue is partially disclosed in the text of the submitted materials, since it says that "in the first years after the initial public offering of Facebook shares, manipulation of this stock asset may have taken place." It seems that a scientific article should give a specific answer to the question, and in the absence of such an opportunity, an assessment of such a probability. Research methodology. The study was performed using real numerical data on the annual financial and market indicators of Google, Facebook and Nasdaq. It is valuable that the author chose a relatively long period of research (2005-2020), and also performed his own calculations based on these data. Also advantageous is the fact that the data is presented graphically. The relevance of the study, in general, hypothetically exists, but it is more interesting to conduct it on the basis of Russian data or to indicate in the text the significance for Russian theory and practice. Scientific novelty. The research topic was chosen to be interesting, there are quite a few high-quality works on which, but a clearer definition of the elements of scientific novelty in the text is required, since in the current version it is not entirely clear what to do with the results of the analysis? What follows from them? Where and by whom can they be used? Style, structure, content. The style of presentation is scientific. The structure of the work is built competently, but add a little section that allows you to submit proposals for solving the identified problems. It is also important to note that the text does not clearly identify the problems arising from the author's analysis of the issues under consideration. Accordingly, when finalizing the content of the article, it is necessary to identify problems (with mandatory alignment with the results of the analysis) and ways to solve them (in conjunction with these problems). It would also be interesting to expand these tables with columns containing either the results of a quantitative or qualitative assessment (perhaps it makes sense to combine tables 1 and 2 and 3, given the fact that the subject and predicate in them are the same). Bibliography. The author has compiled a list of references and consists of 20 sources (both domestic and foreign). At the same time, it does not contain any statistical sources of information, despite the fact that numerical data are actively used in the text of the reviewed materials. Appeal to opponents. Despite the given list of references, the author of the presented materials has not carried out any scientific discussion with other researchers, which significantly reduces the impression of familiarization with this article. It is important to note that solving this problem will also contribute to a clearer definition of the elements of scientific novelty, as well as allow us to determine the potential readership. Conclusions, the interest of the readership. Taking into account all the above, it is recommended to finalize the article taking into account the comments indicated in the text. After qualitative revision and re-review, the issue of its publication may be considered, including with a mandatory assessment of interest for the readership (since the current version is of interest to an extremely limited number of people).
Third Peer Review
Peer reviewers' evaluations remain confidential and are not disclosed to the public. Only external reviews, authorized for publication by the article's author(s), are made public. Typically, these final reviews are conducted after the manuscript's revision. Adhering to our double-blind review policy, the reviewer's identity is kept confidential.
The list of publisher reviewers can be found here.
The article is devoted to the analysis of stock markets, the subject of research in the reviewed material is the issues of manipulation of stock assets, which are considered on the example of shares of American high-tech companies of the Nasdaq stock exchange. The research methodology is based on the study of the literature on the research topic, the analysis of stock market data using statistical methods, techniques of correlation and regression and comparative analysis, the use of Excel spreadsheet data analysis packages. The authors attribute the relevance of the work to the unprecedented development of the financial and stock sectors of the economy, their increasing influence on the global economy. The scientific novelty of the reviewed study, according to the reviewer, consists in the methodology proposed by the authors for identifying signs of manipulation of company shares based on the analysis of stock market data. The results of the study can find practical application in the selection and implementation of the most preferred and less risky investment strategies. Facebook, Google and Nasdaq are structurally divided into the following sections: Introduction, Concept and methods of manipulation of stock assets, Comparative analysis of the dynamics of quotations of American high-tech companies Facebook, Google and Nasdaq since their placement on the stock exchange, Correlation analysis of investment multipliers of Facebook, Google and Nasdaq companies, Conclusion and Bibliography. The article refers to the processes of manipulation of stock assets as a set of targeted impacts (informational, financial, economic, political, etc.) of the subject of manipulation on stock market participants to stimulate their joint activities aimed at forming the target value of stock assets. The authors consider the main feature of manipulation to be a significant difference between stock quotes of a stock asset, which arose as a result of the action of the subject of manipulation on stock market participants, and stock quotes of a stock asset, which would have been formed without such an action. The paper considers the following practices of manipulation of stock assets: the use of insider information; various trading techniques and technologies that affect stock market participants; distortion of accounting and financial statements of the company. The financial indicators and stock quotes of Facebook companies for 2012-2020, Google for 2004-2020, Nasdaq for 2005-2020 are considered, visualization of the dynamics of the multiplier of investment attractiveness is presented. The bibliographic list includes 27 sources – publications of foreign and domestic scientists on the topic of the article, as well as Internet resources to which there are address links in the text confirming the existence of an appeal to opponents. The following points should be noted as comments. Firstly, the introductory part of the article seems disproportionately voluminous in comparison with other sections – part of the material from the Introduction, which provides a literature review, is proposed to be moved to subsequent sections, since in fact here the reader is no longer introduced to the course of the scientific problem being solved, but various points of view are presented, comparisons and generalizations are made. Secondly, it would be more understandable for the reader to present the information reflected in Tables 4 and 5 in the form of a familiar matrix of paired correlation coefficients. Thirdly, formula (1) must be drawn up in accordance with the requirements, accompanied by a generally accepted interpretation of the symbols used. It is also necessary to delete additional notes addressed to reviewers before publication. The article reflects the results of the research conducted by the authors, corresponds to the direction of the journal "Finance and Management", contains elements of scientific novelty and practical significance, may arouse interest among readers, and is recommended for publication after the authors consider the reviewer's proposals aimed at improving the article.
Link to this article
You can simply select and copy link from below text field.
|